User Instructions
This section describes user operation procedures. The following operations can also be performed by administrators.
1. Job Execution
Jobs are executed at their scheduled time by registering them to the schedule. Job registration and execution can be performed by either an administrator or a user.
There are two ways to register a job: by scheduling a new job or by referring to the past history.
This section describes 1.1. New Job Scheduling, 1.2. Job History, and 1.3. Scheduling Jobs Based on History in this order.
1.1. New Job Scheduling
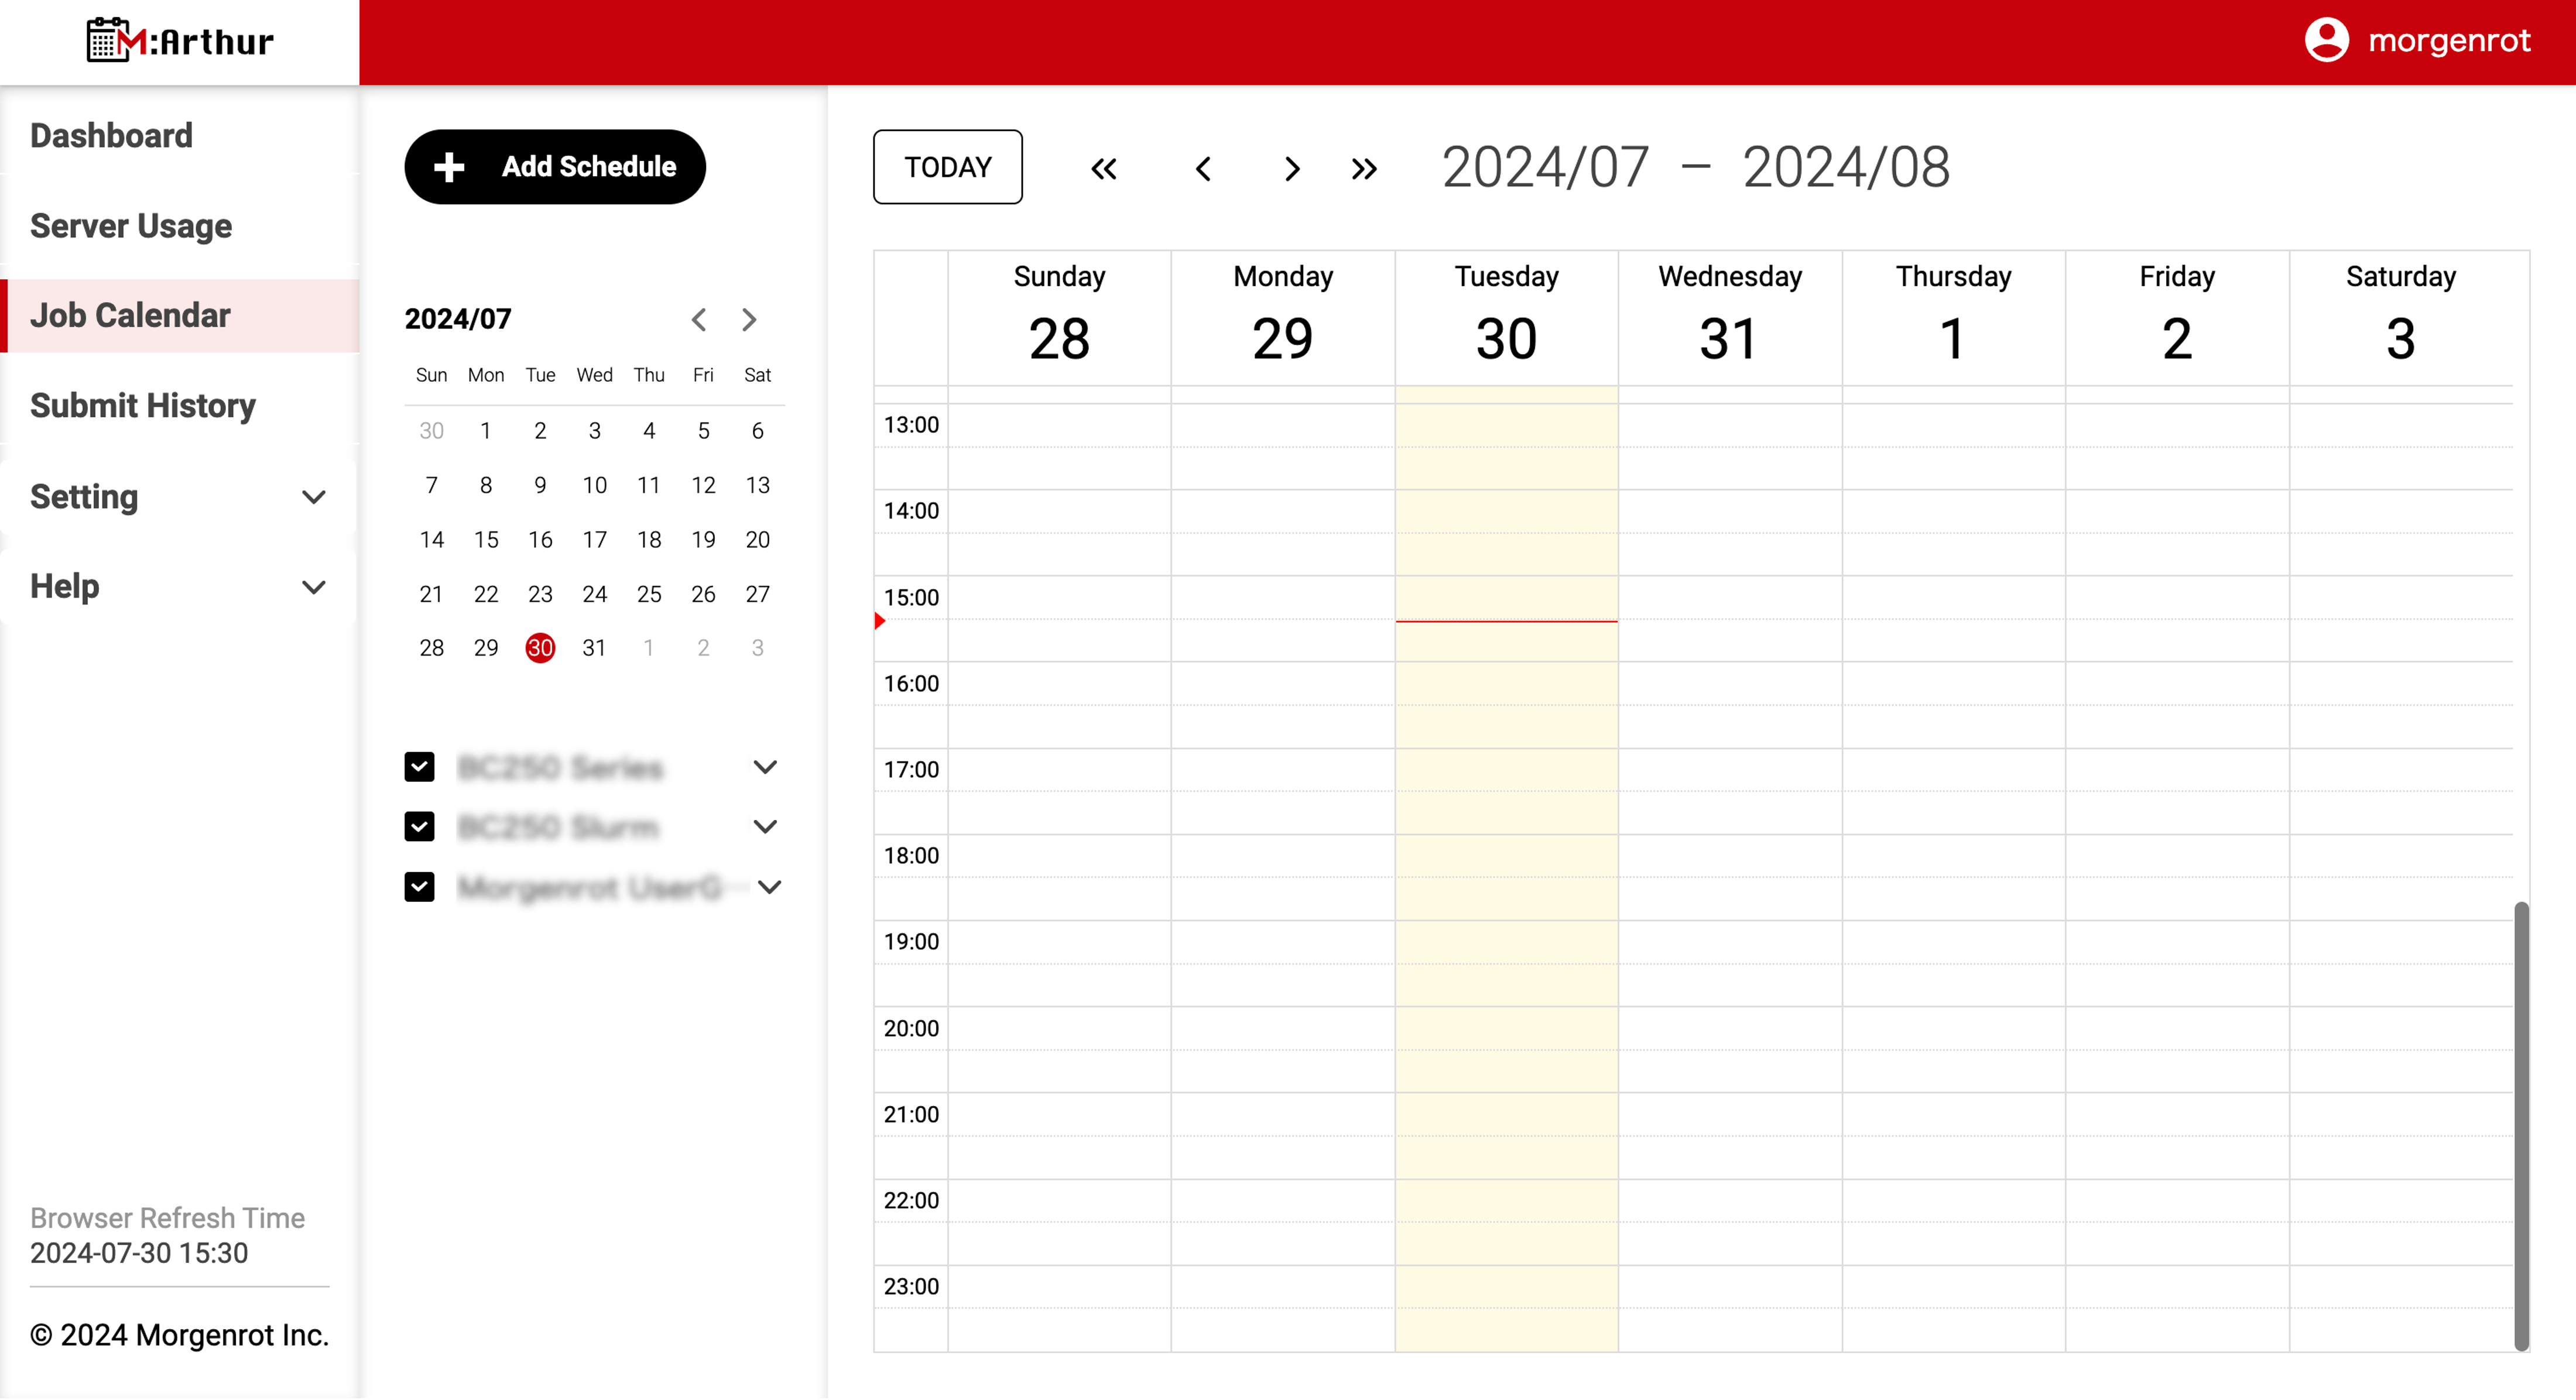
To schedule a new job, first select〈Job Calendar〉from the left menu bar to open the【Job Calendar】screen.
To register a job, click the[+Add Schedule]button in the upper-left corner of the【Job Calendar】screen.
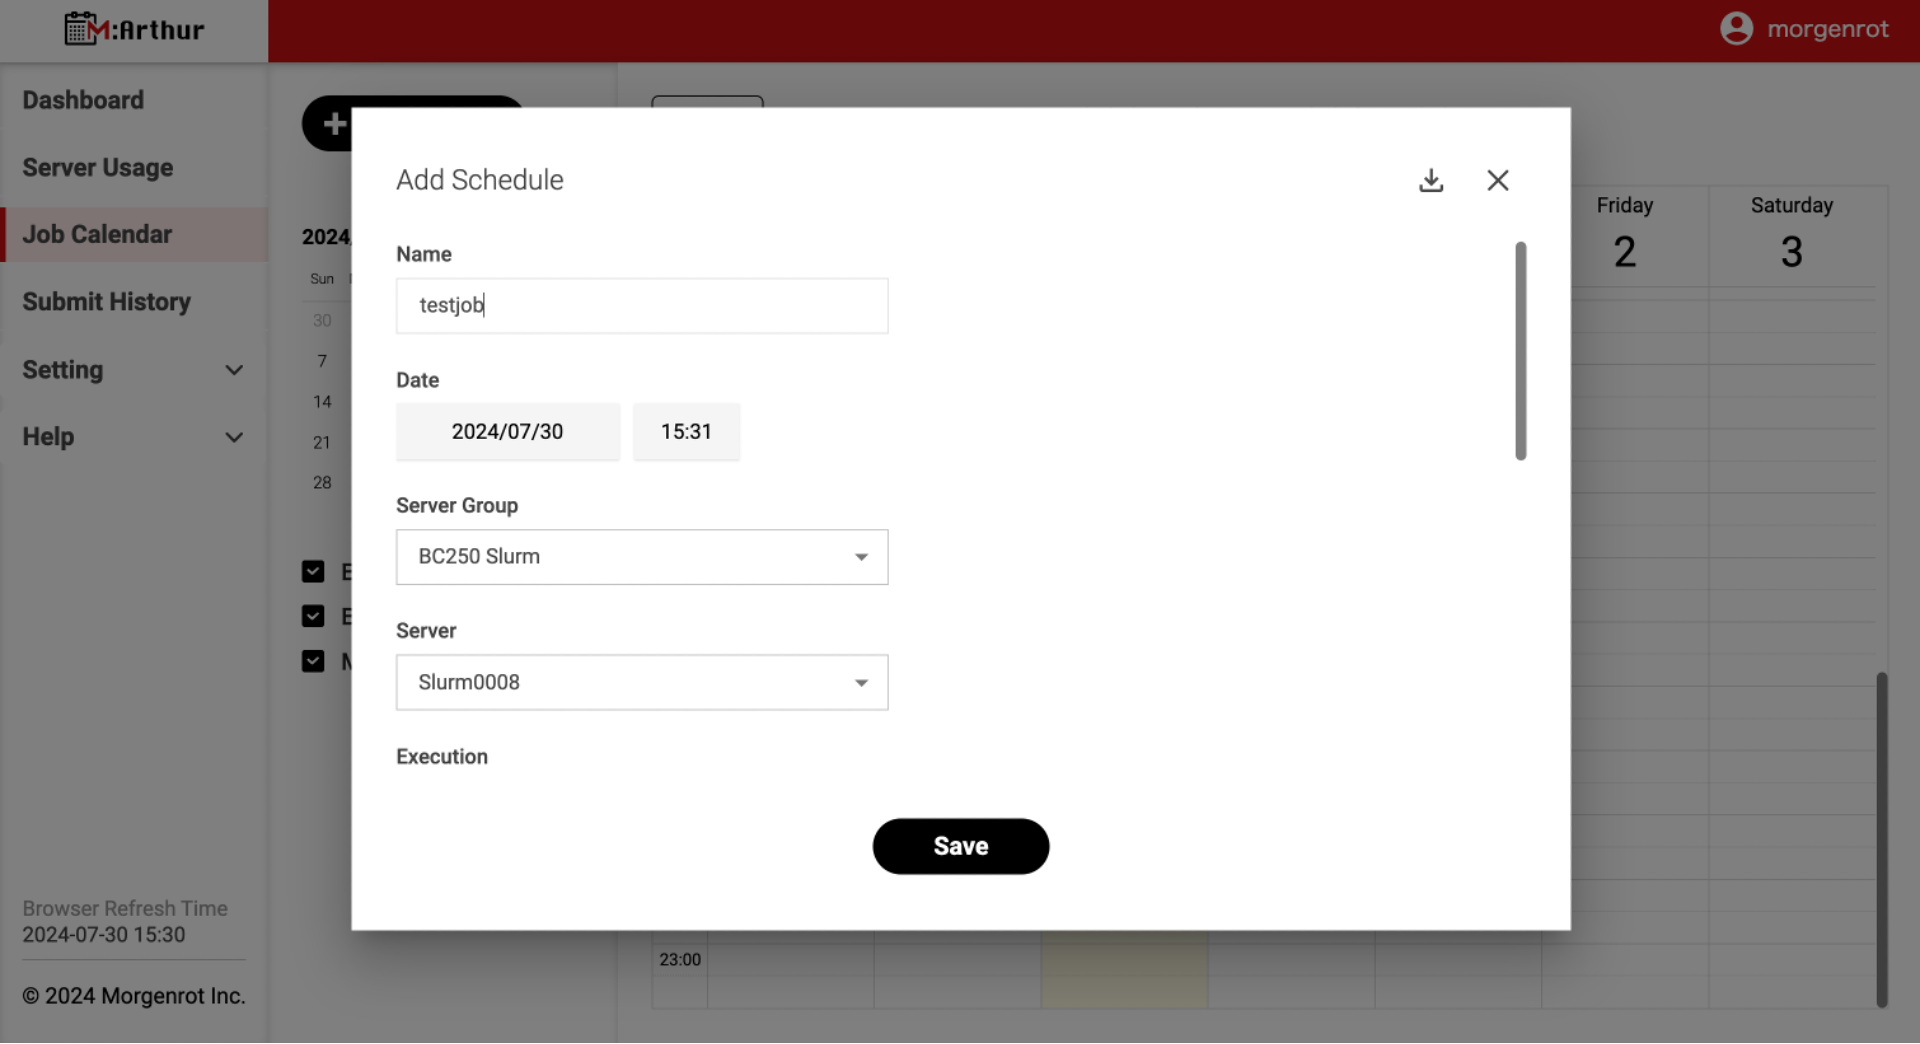
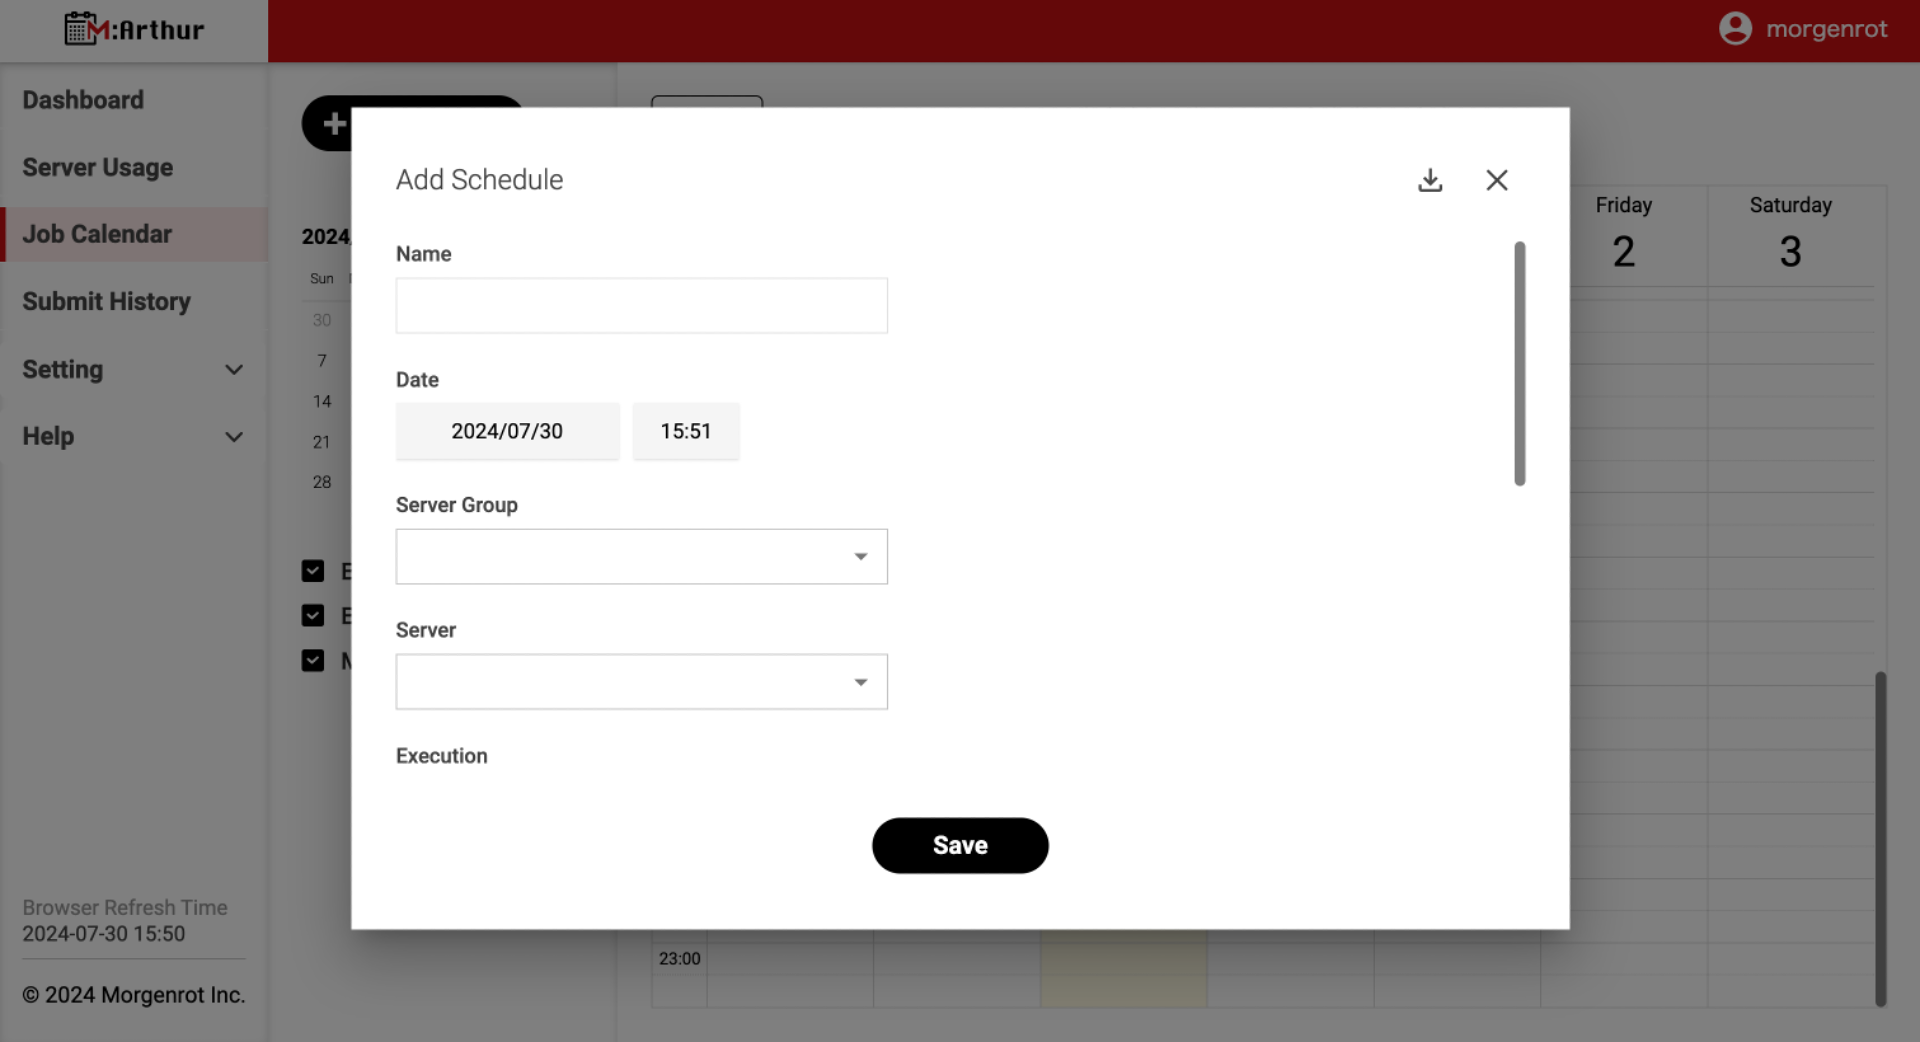
Clicking the [+Add Schedule] button will display the 【Add Schedule】 modal screen. Here, scroll through the screens and describe the information required to register a job.
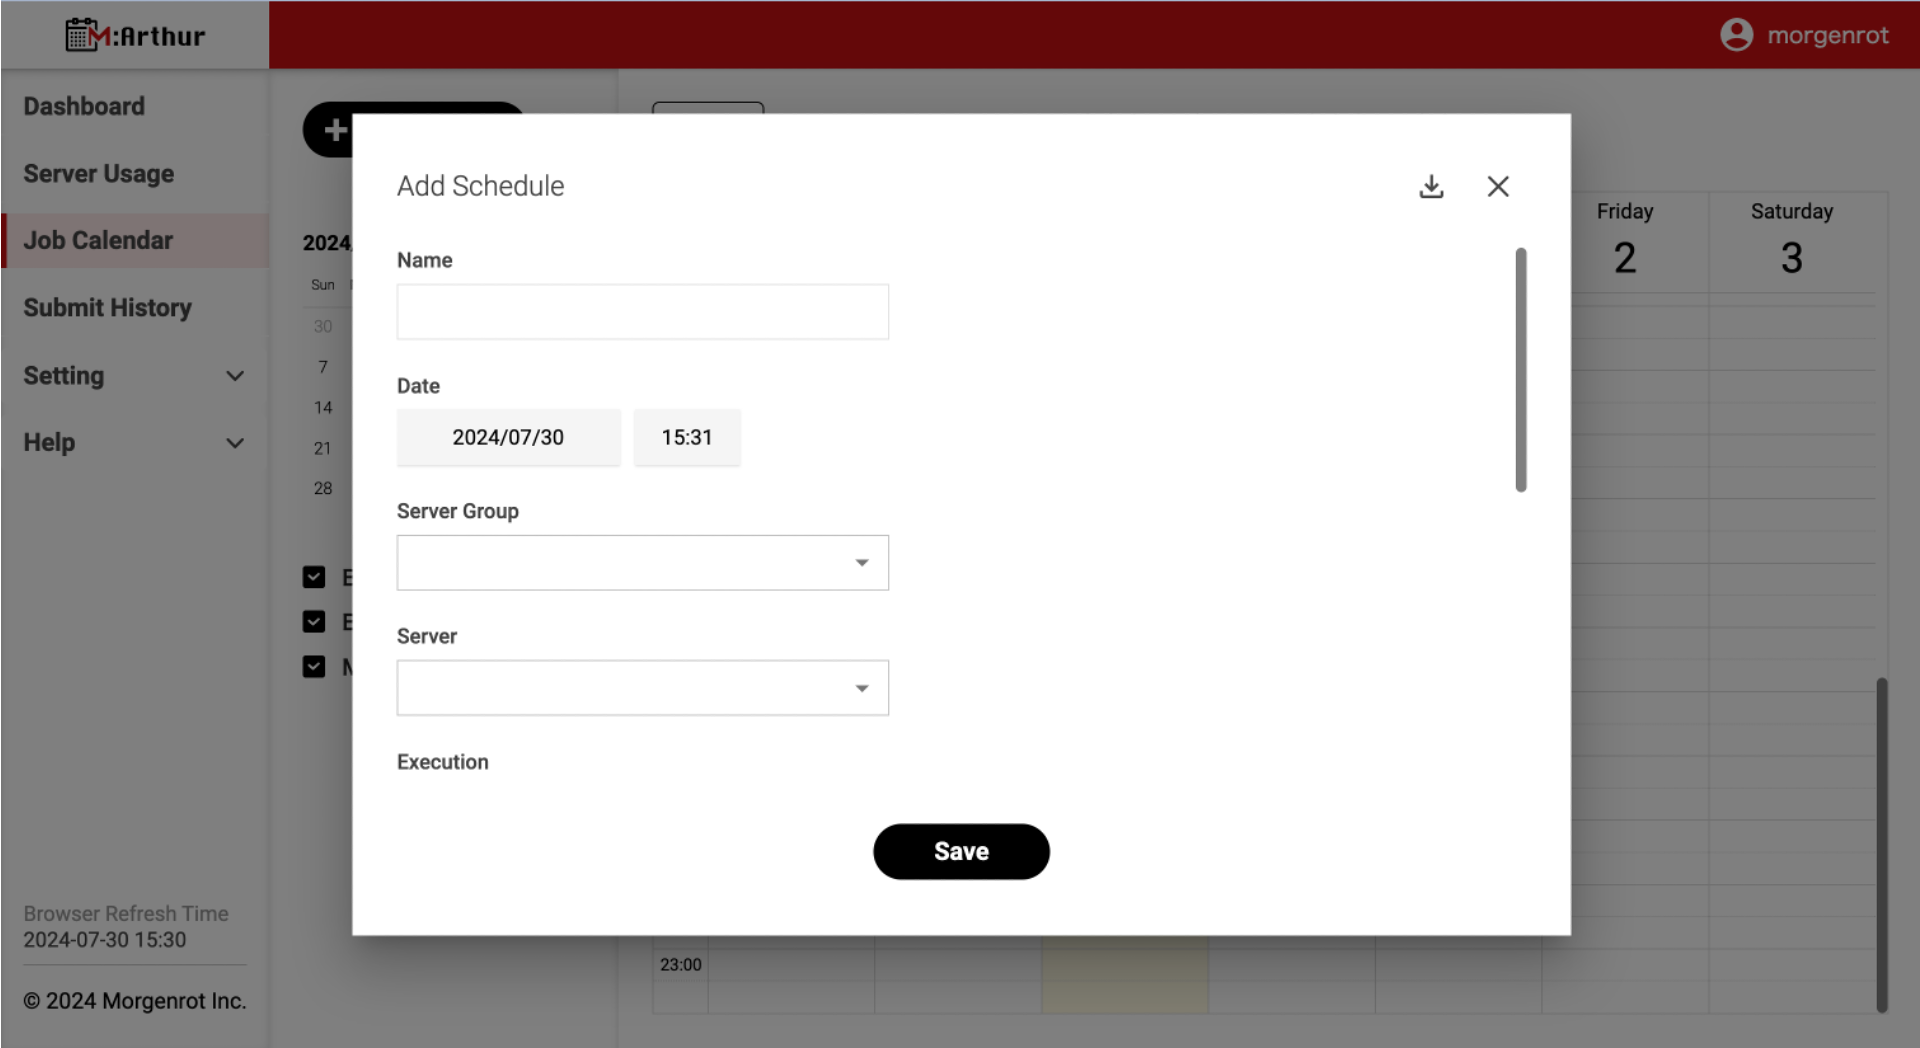
Entries are as follows.
| Item | Description |
|---|---|
| Name | The registration name of the job. You can set it freely. It is a required field. |
| Date | The scheduled start time of the job. Set the date and time. This field is required. |
| Server Group | The name of the server group where the job will be run. Select from the pull-down menu. This field is required. |
| Server | The name of the server where the job will be executed. After the server group name is selected, it can be selected from the pull-down menu. This field is required. |
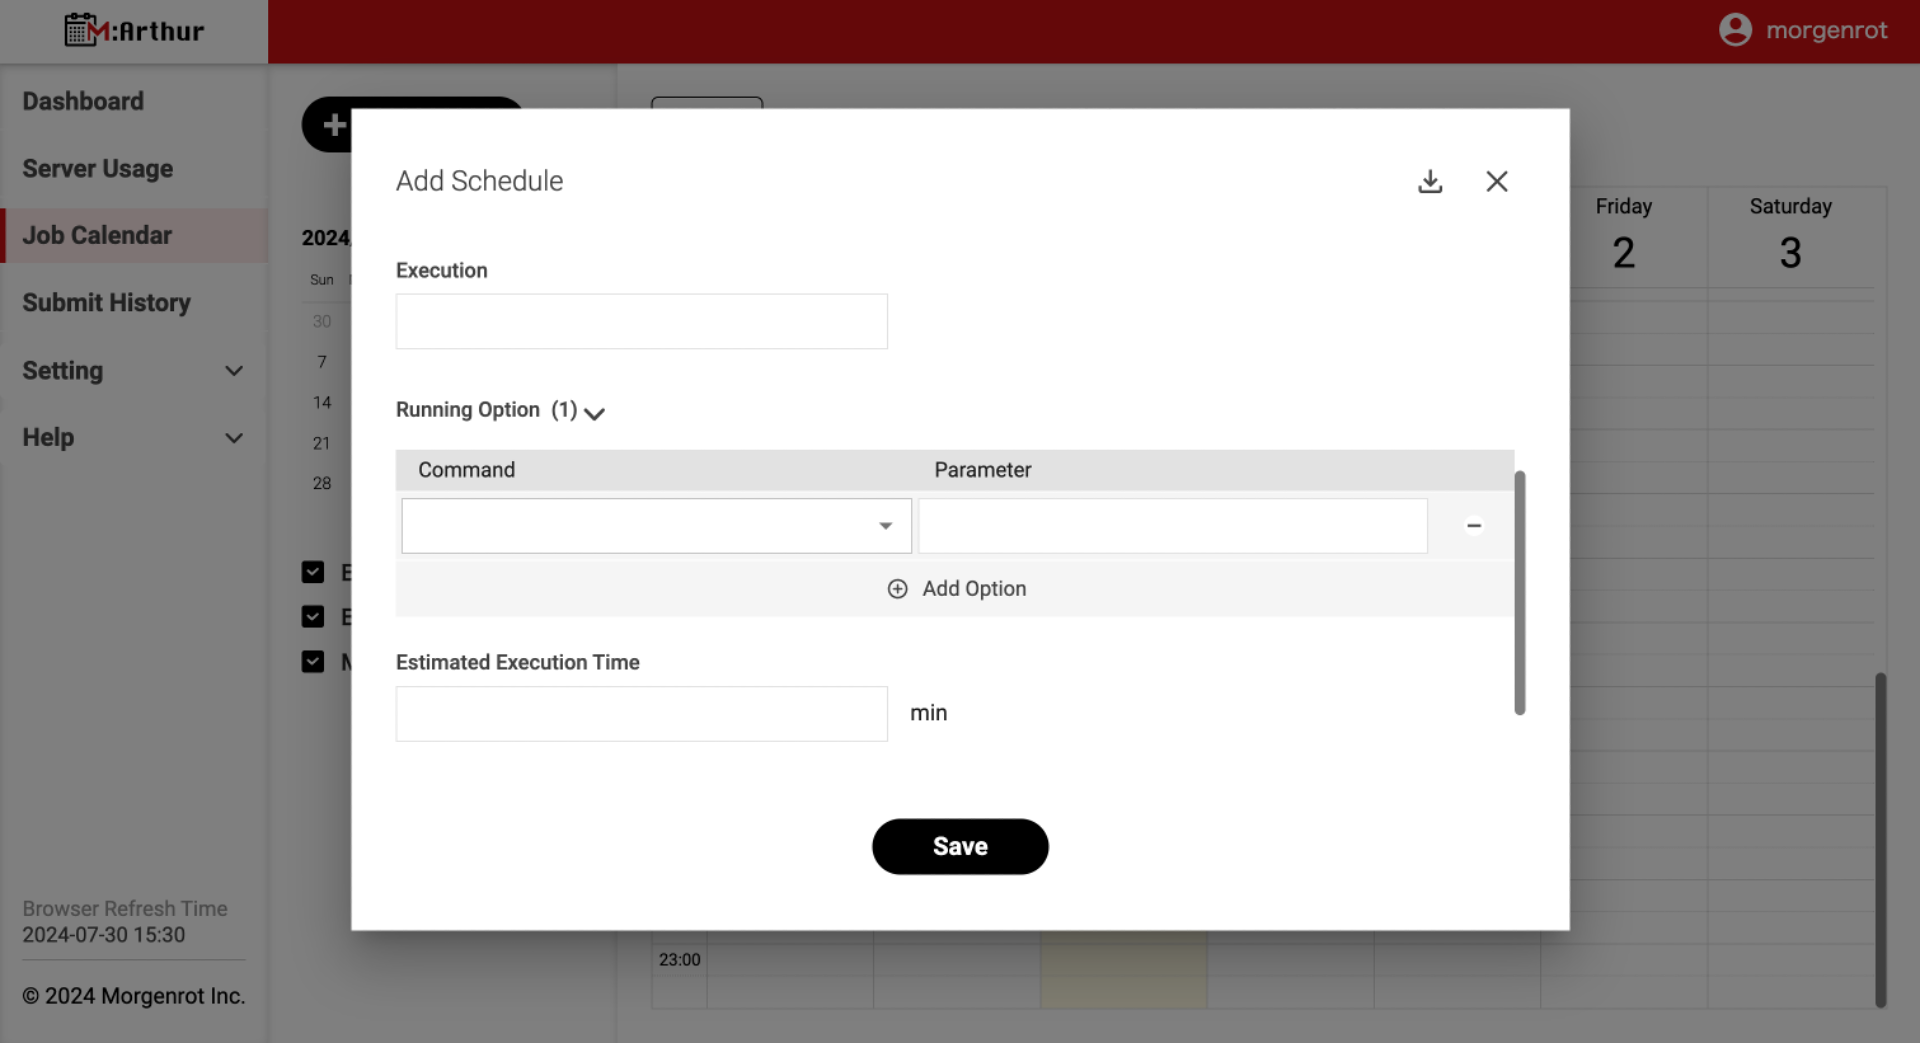
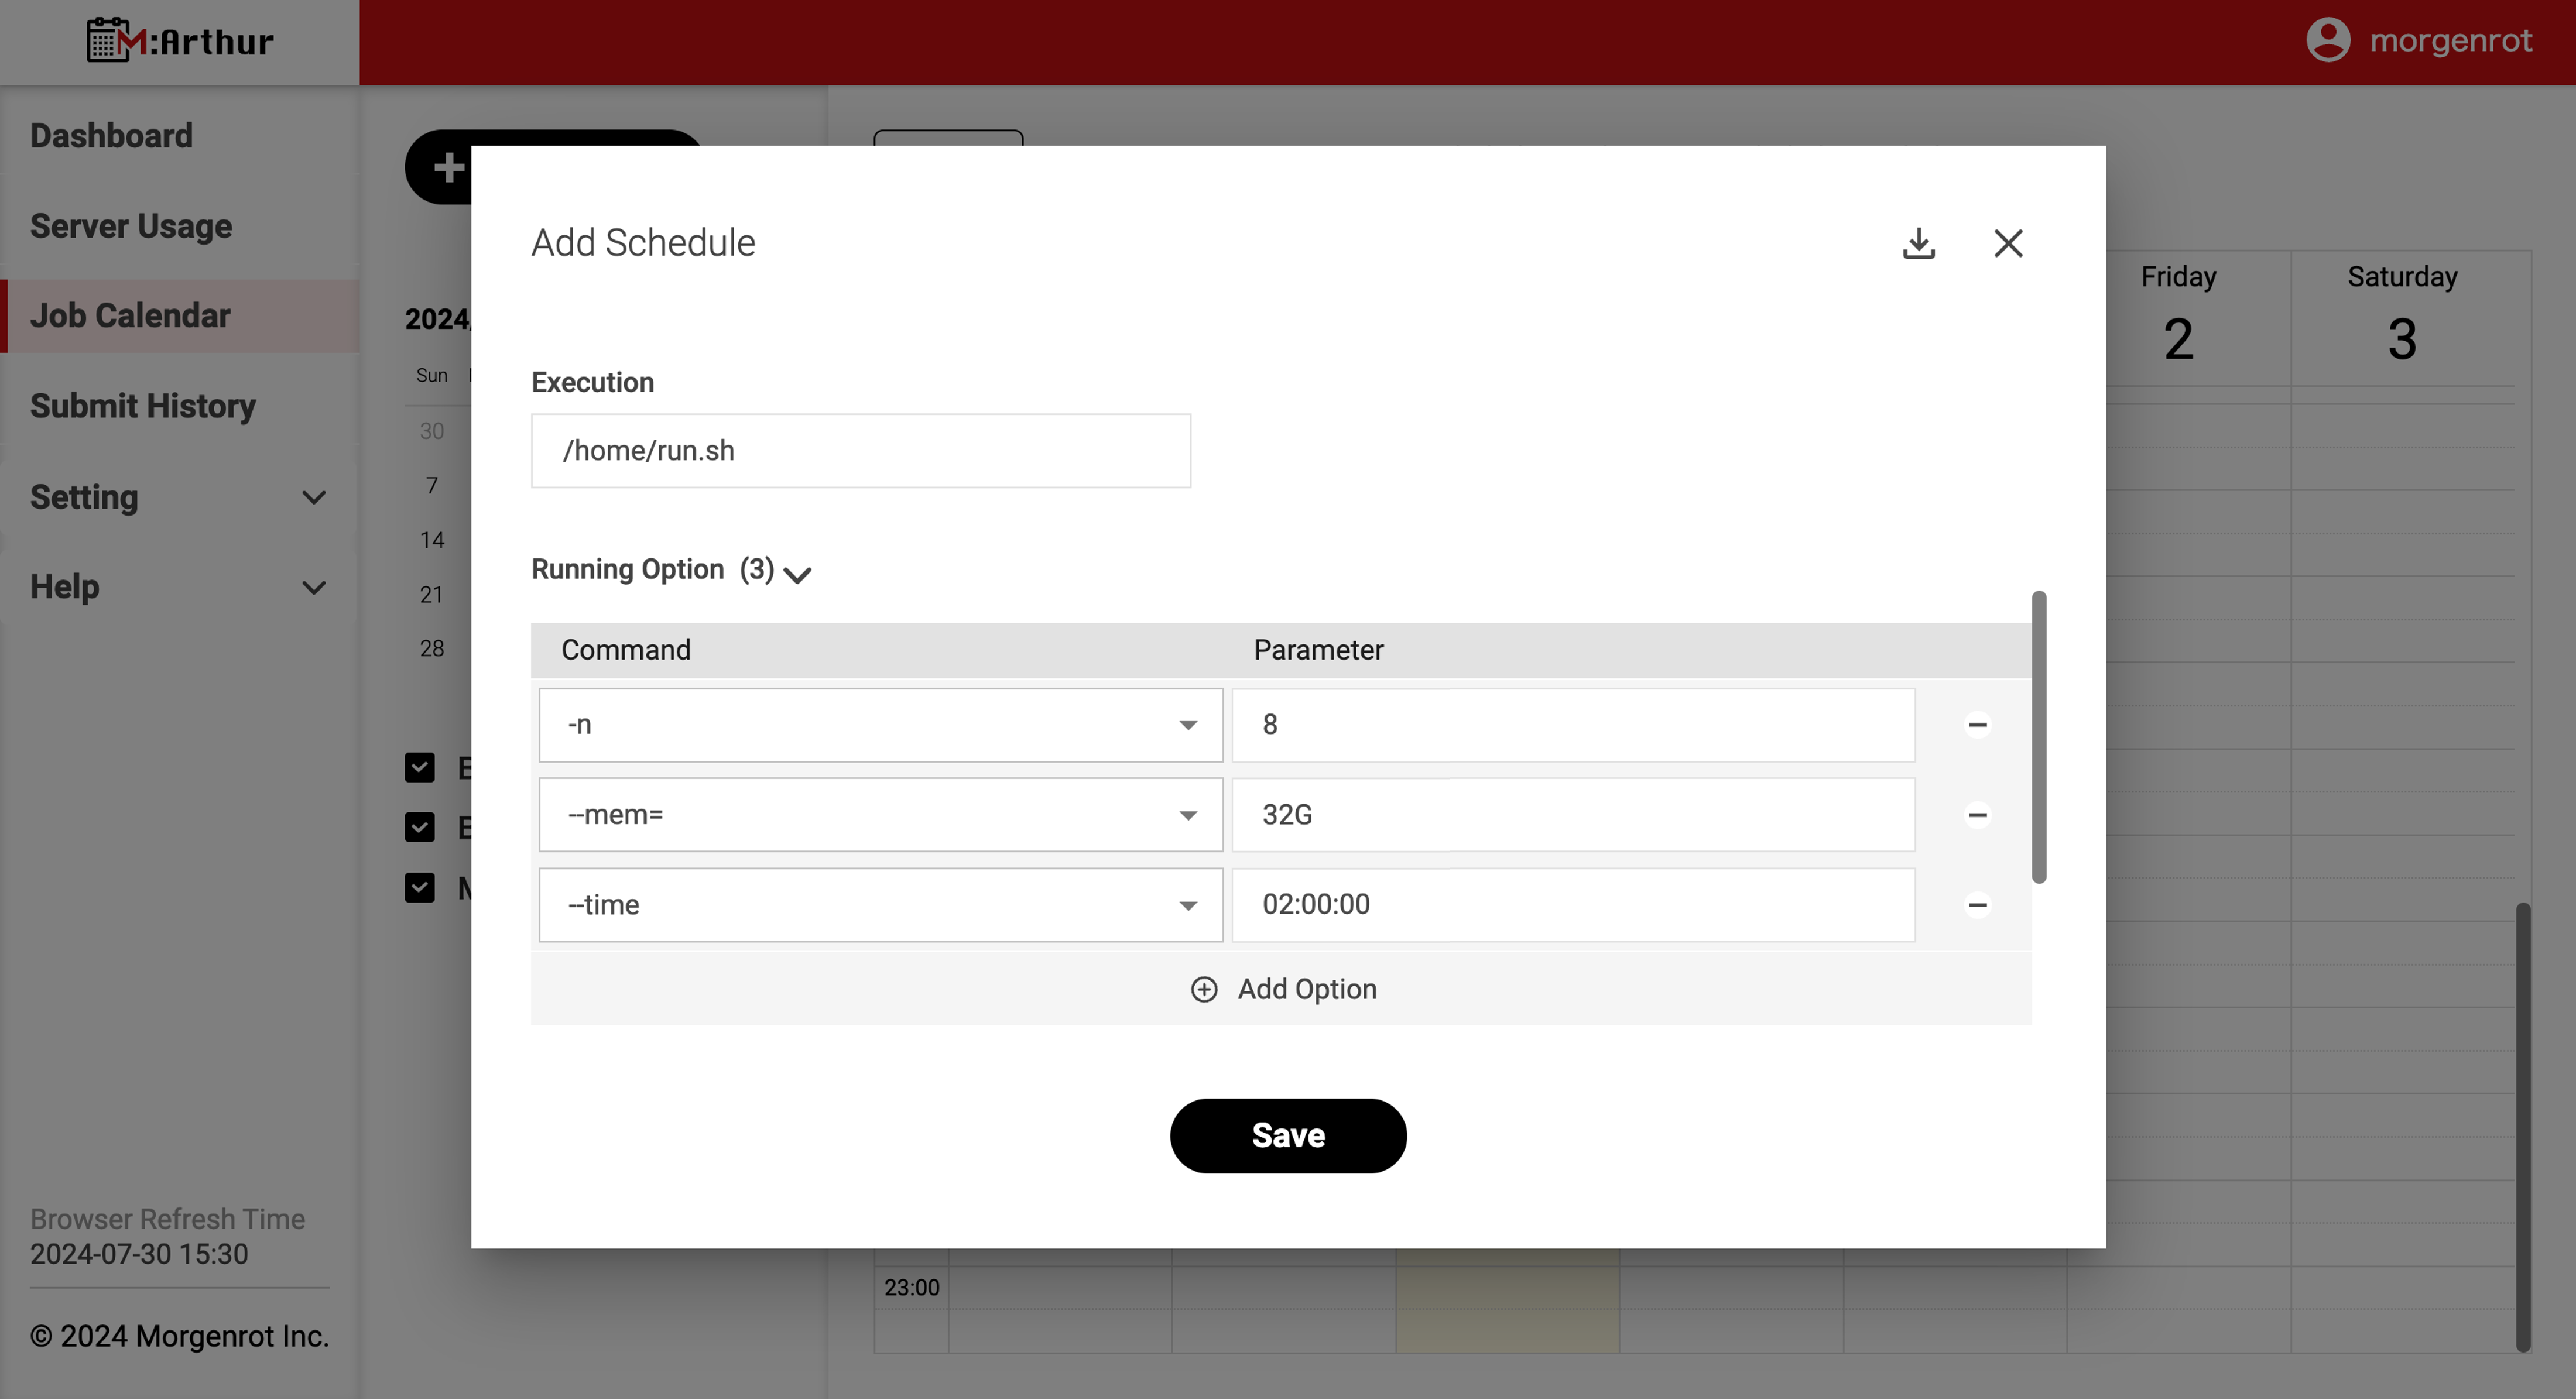
| Execution | The command to be executed on the login node. The execution command(「qsub」 in the case of OpenPBS, 「sbatch」 in the case of Slurm)is not required. For example, if the command is 「qsub ../home/run.sh」, then Execution should be 「../home/run.sh」. |
| Running Option | Enter when options are set as arguments to the job’s execution command. The format should be the same as the job scheduler (Slurm or OpenPBS) set up for the above server. For more information on the options that can be set and their format, please refer to Appendix for the options and formats that can be set. |
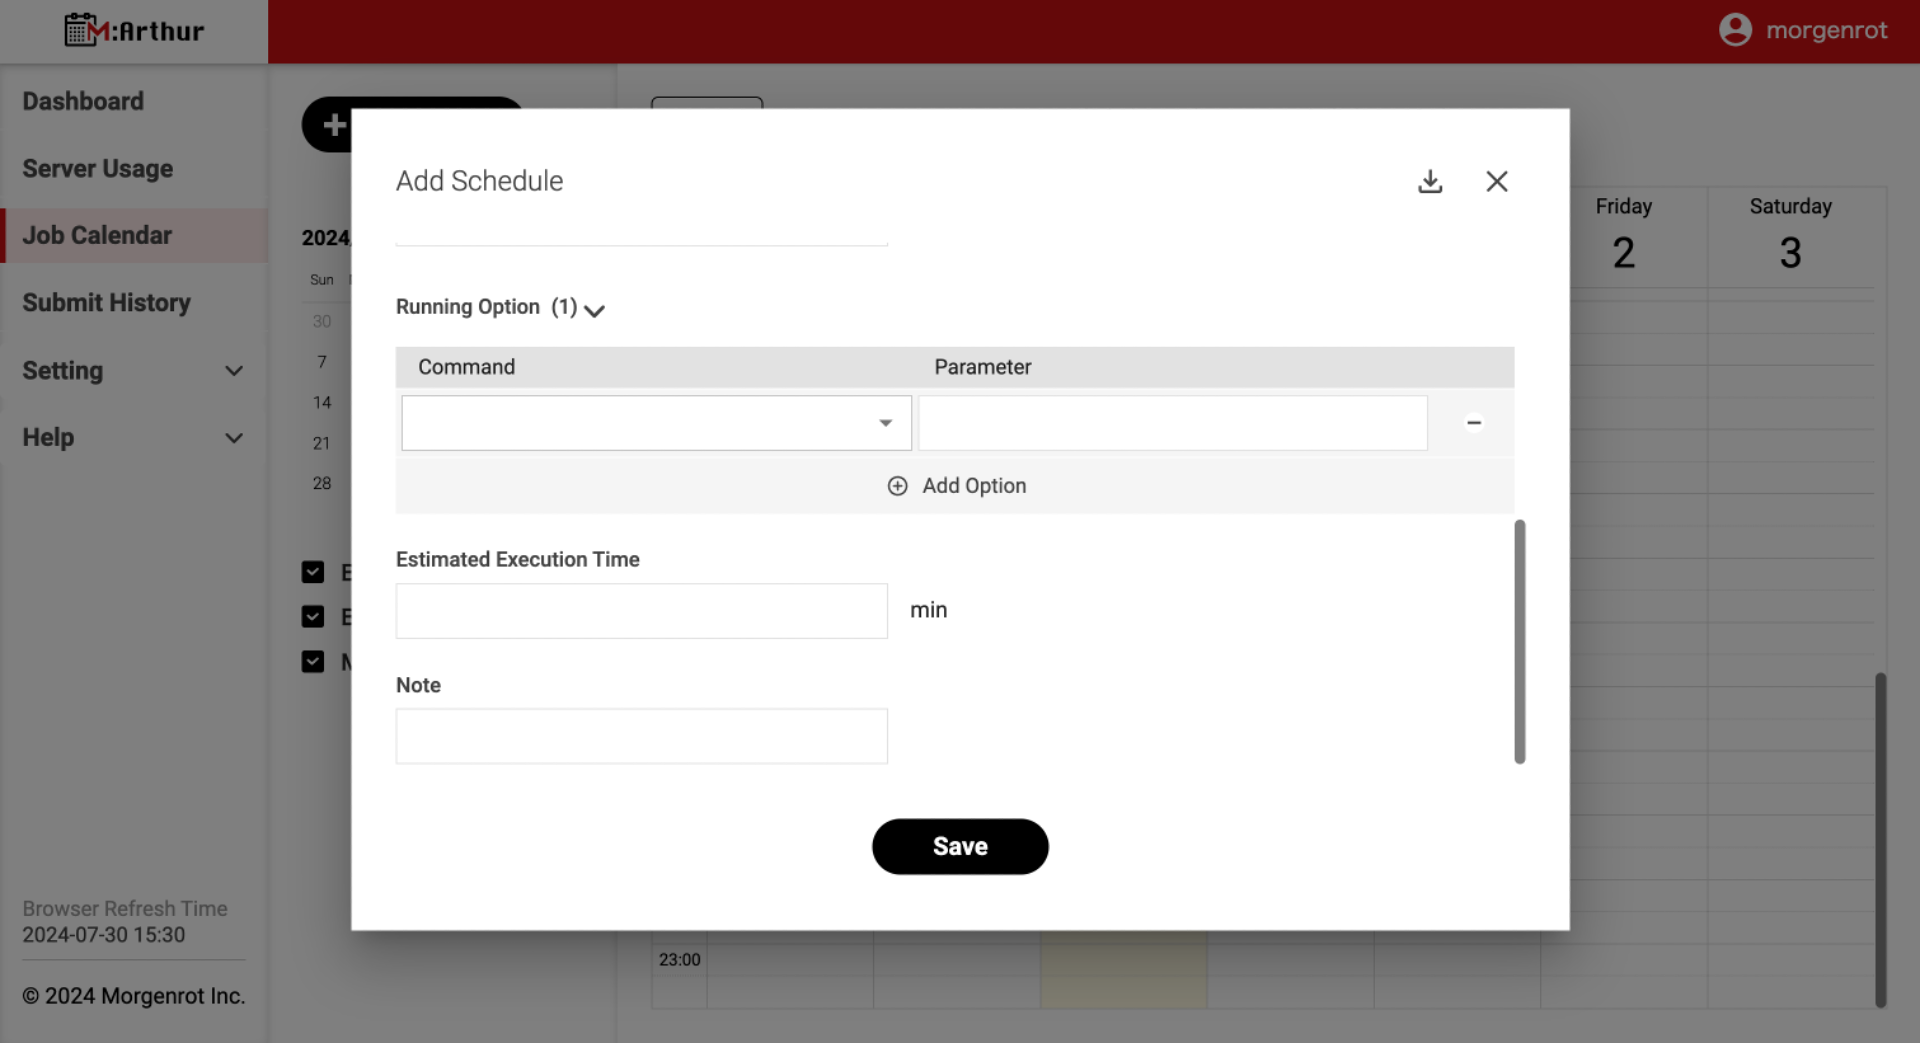
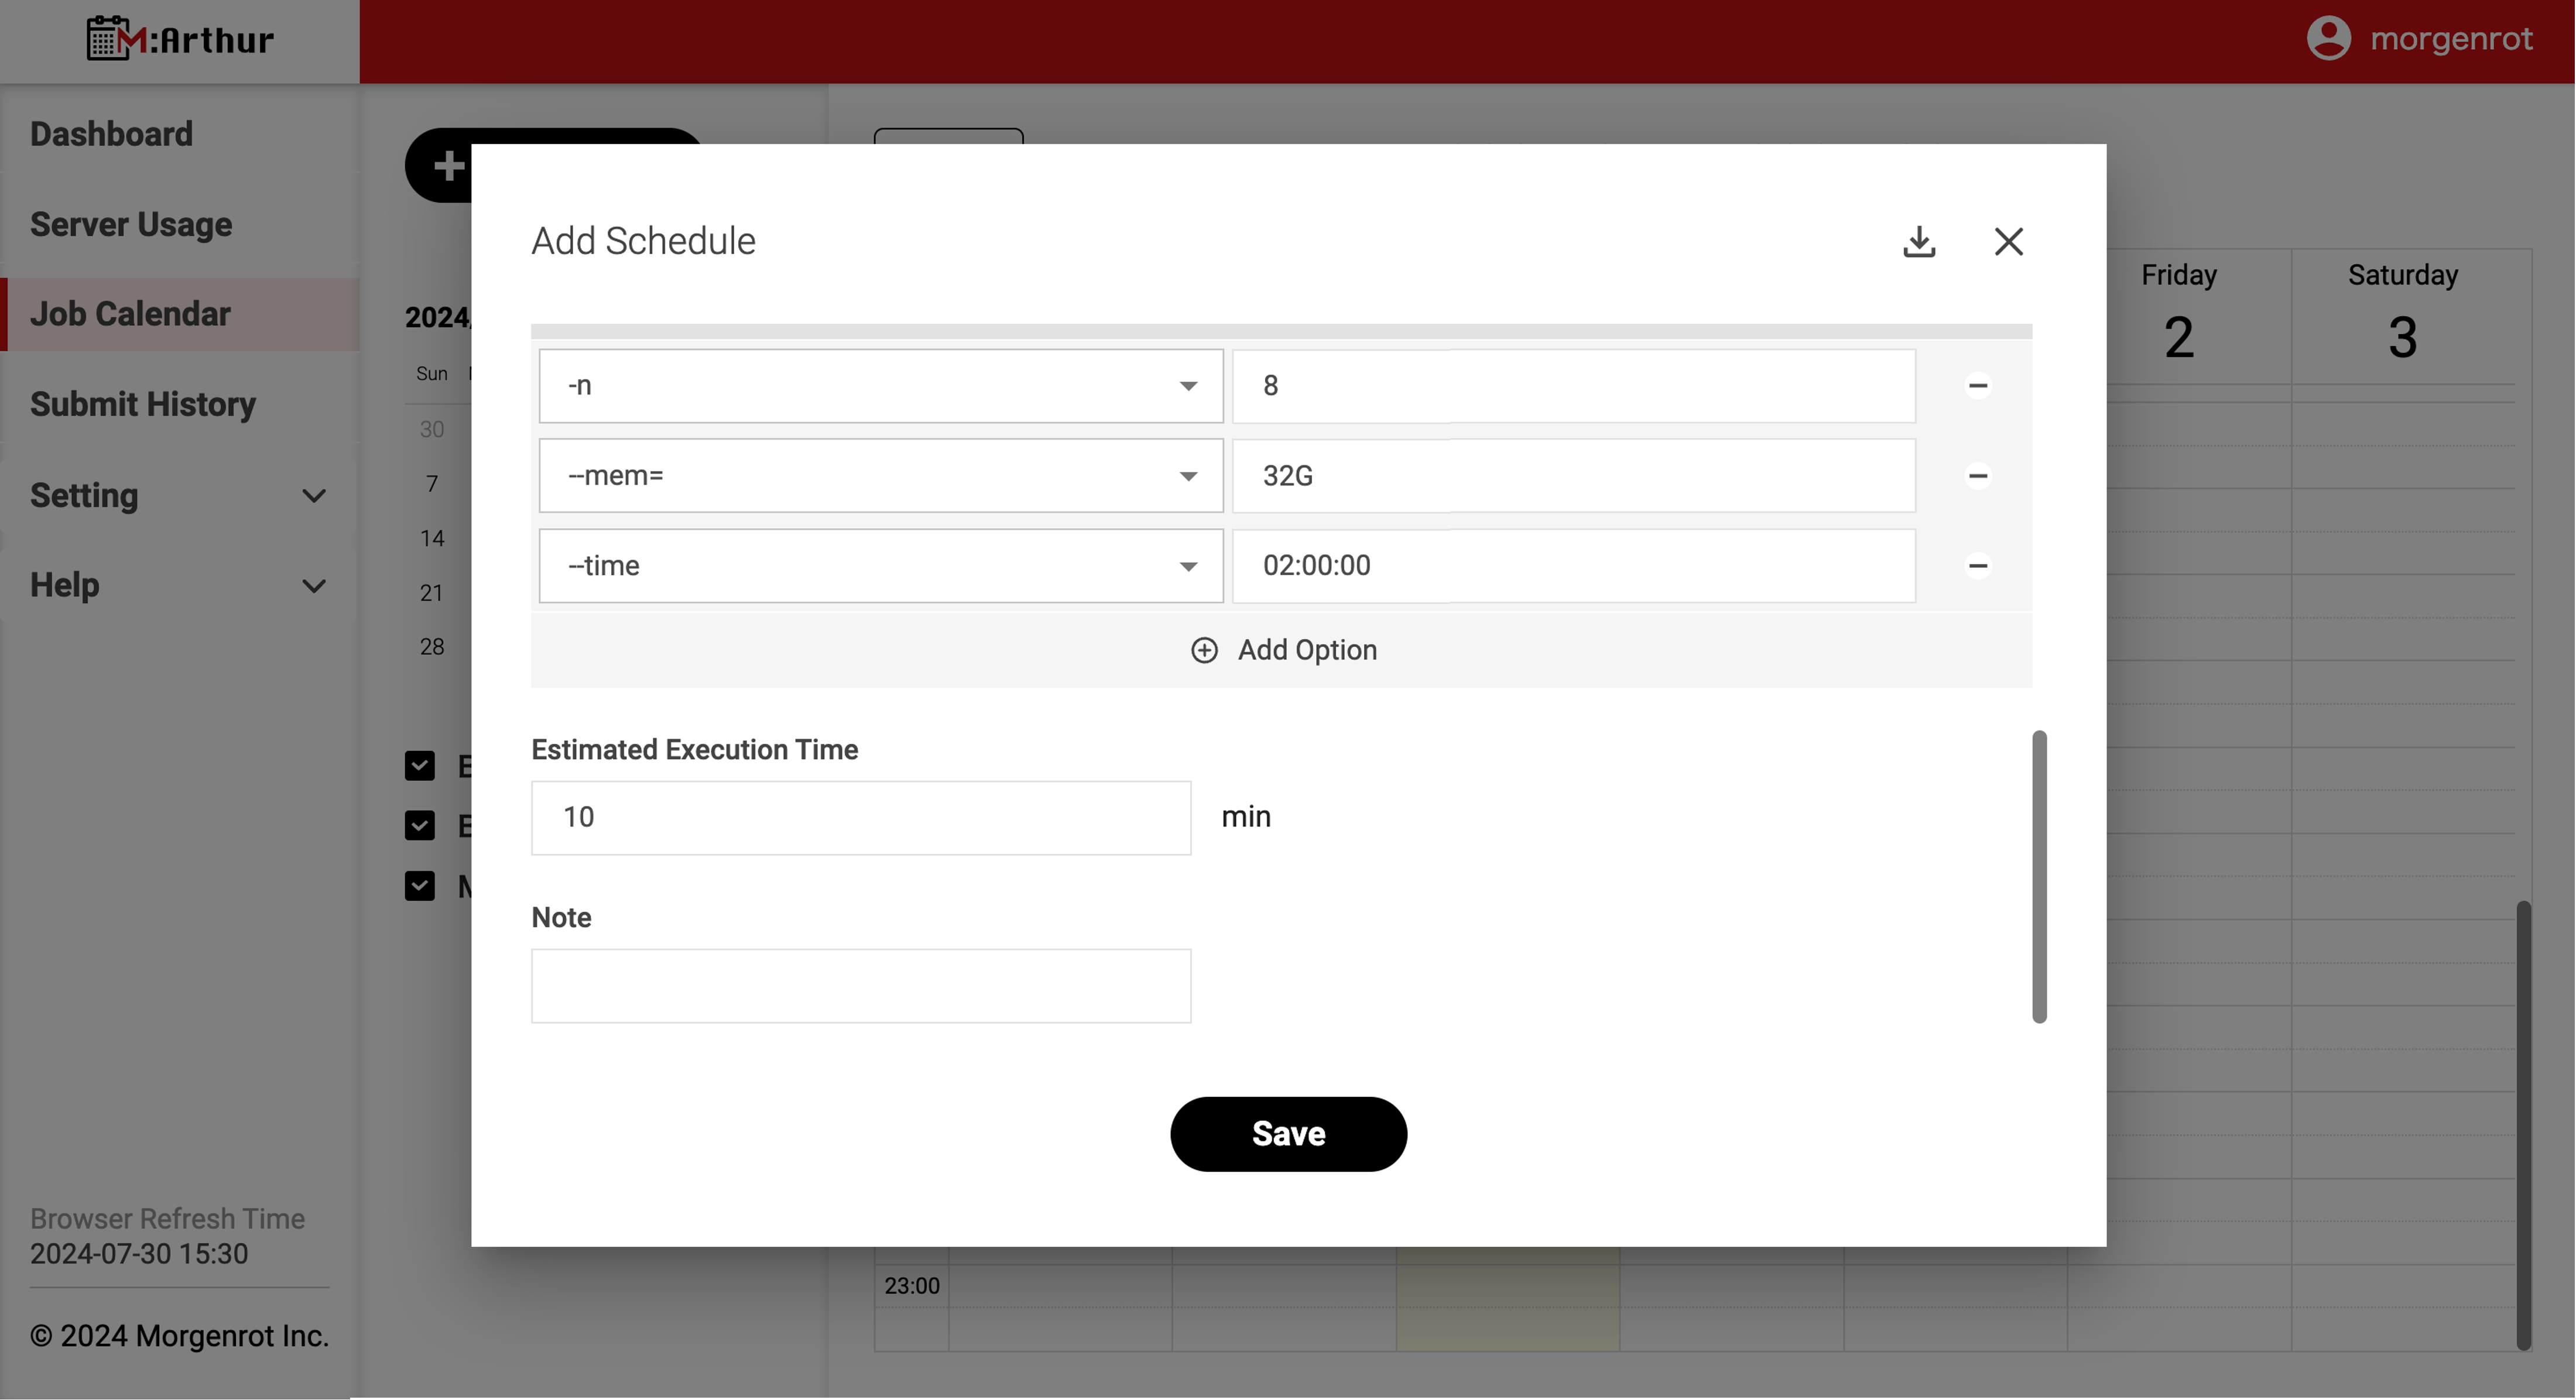
| Estimated Execution Time | The estimated time the job will take. Enter the time in minutes. If you enter this information, when the job is executed, the item will be displayed on the calendar in a size corresponding to the time required. |
| Note | This is the note field. You can set it as you like. |
Tips
The following is an example of an execution command. (The following example assumes that the .sh file is stored in /home/calculation/.)
In the Execution column, please provide the part excluding「qsub」and「sbatch」.
Example of execution command when using OpenPBS:
qsub /home/calculation/sample_run.sh
Example run command when using Slurm:
sbatch /home/calculation/sample_run.sh
The sample run.sh file is as follows
Sample of Overview/run.sh
Tips
In addition to running the job from M:Arthur, it can also be run on the command line with common execution commands such as 「qsub (executable file name)」 or 「sbatch (executable file name)」.An example entry is shown below. When registering a job, click the[Save]button at the bottom of the【Add Schedule】modal screen.
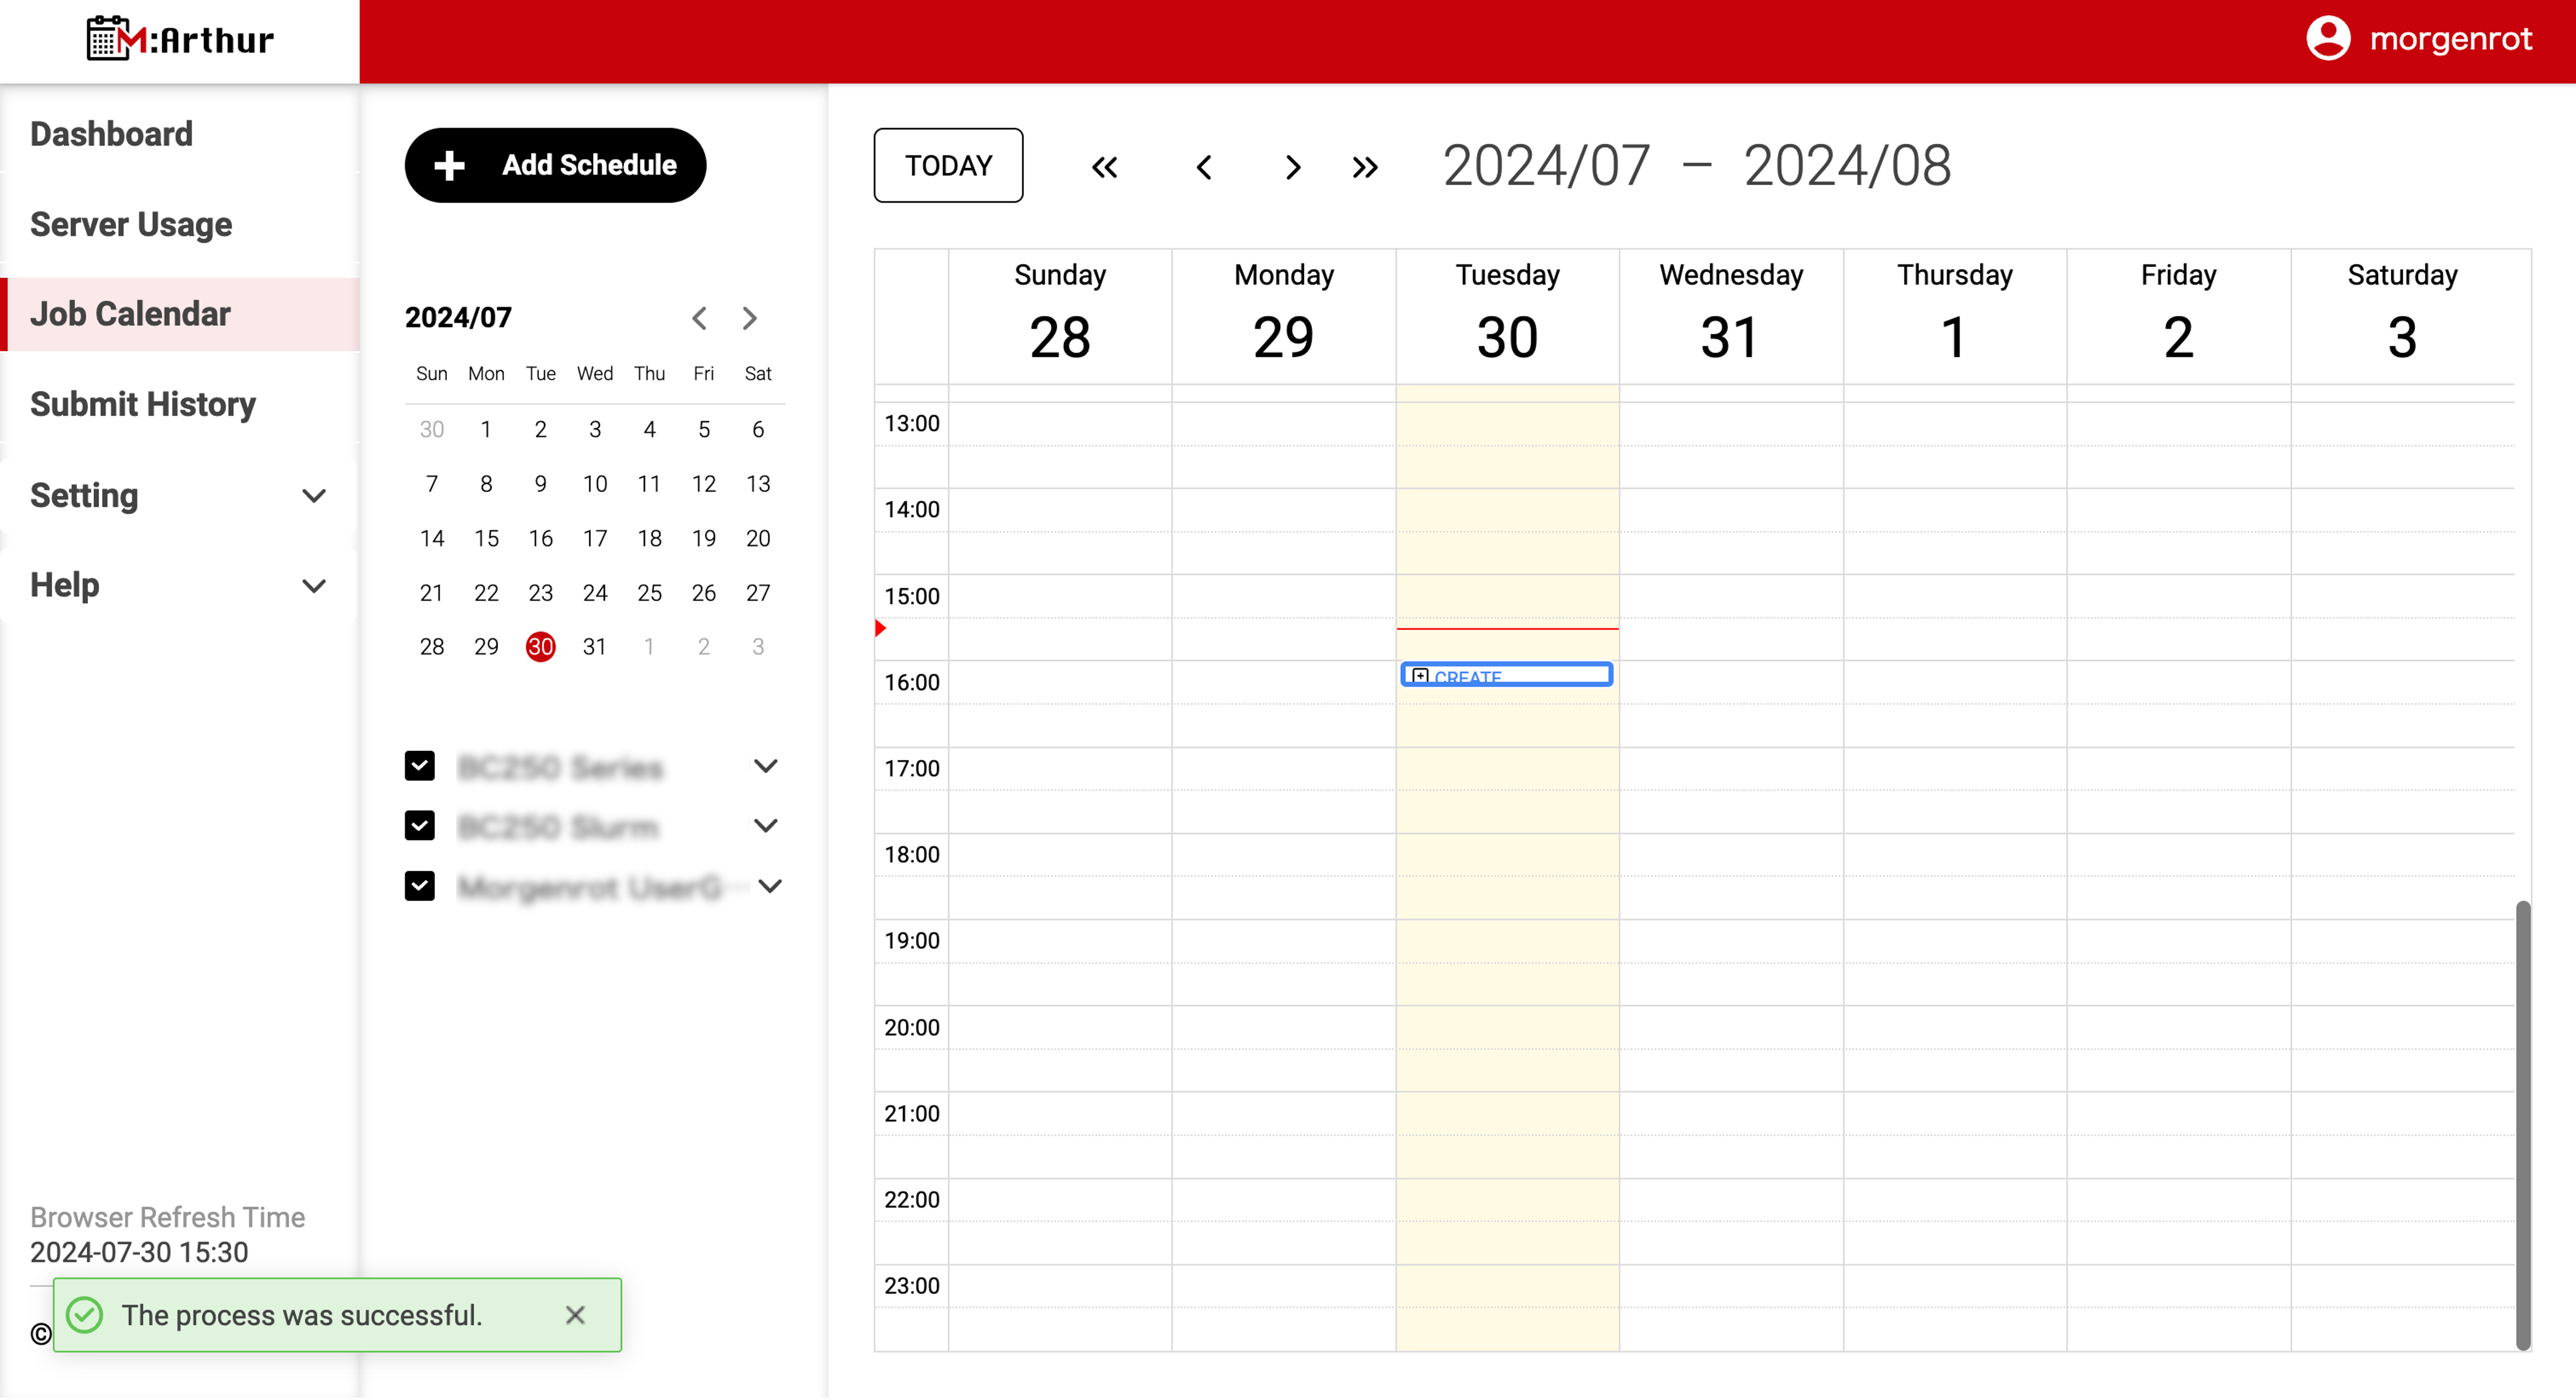
After clicking the[Save]button, the【Job Calendar】screen will display the registered job at the scheduled start time position on the calendar.
When the scheduled start time arrives, the registered job will be executed in accordance with the server and execution conditions set in the above process.
1.2. Job History
Once a job is registered, you can view its information in the【Submit History】screen. This section describes how to view the history of a job.
As explained in 1.3. Scheduling Jobs Based on History in the next section, it is possible to cite the execution conditions in the job history when registering a new job separately.
The job history can be viewed by selecting〈Submit History〉from the left menu bar and displaying the【Submit History】screen.
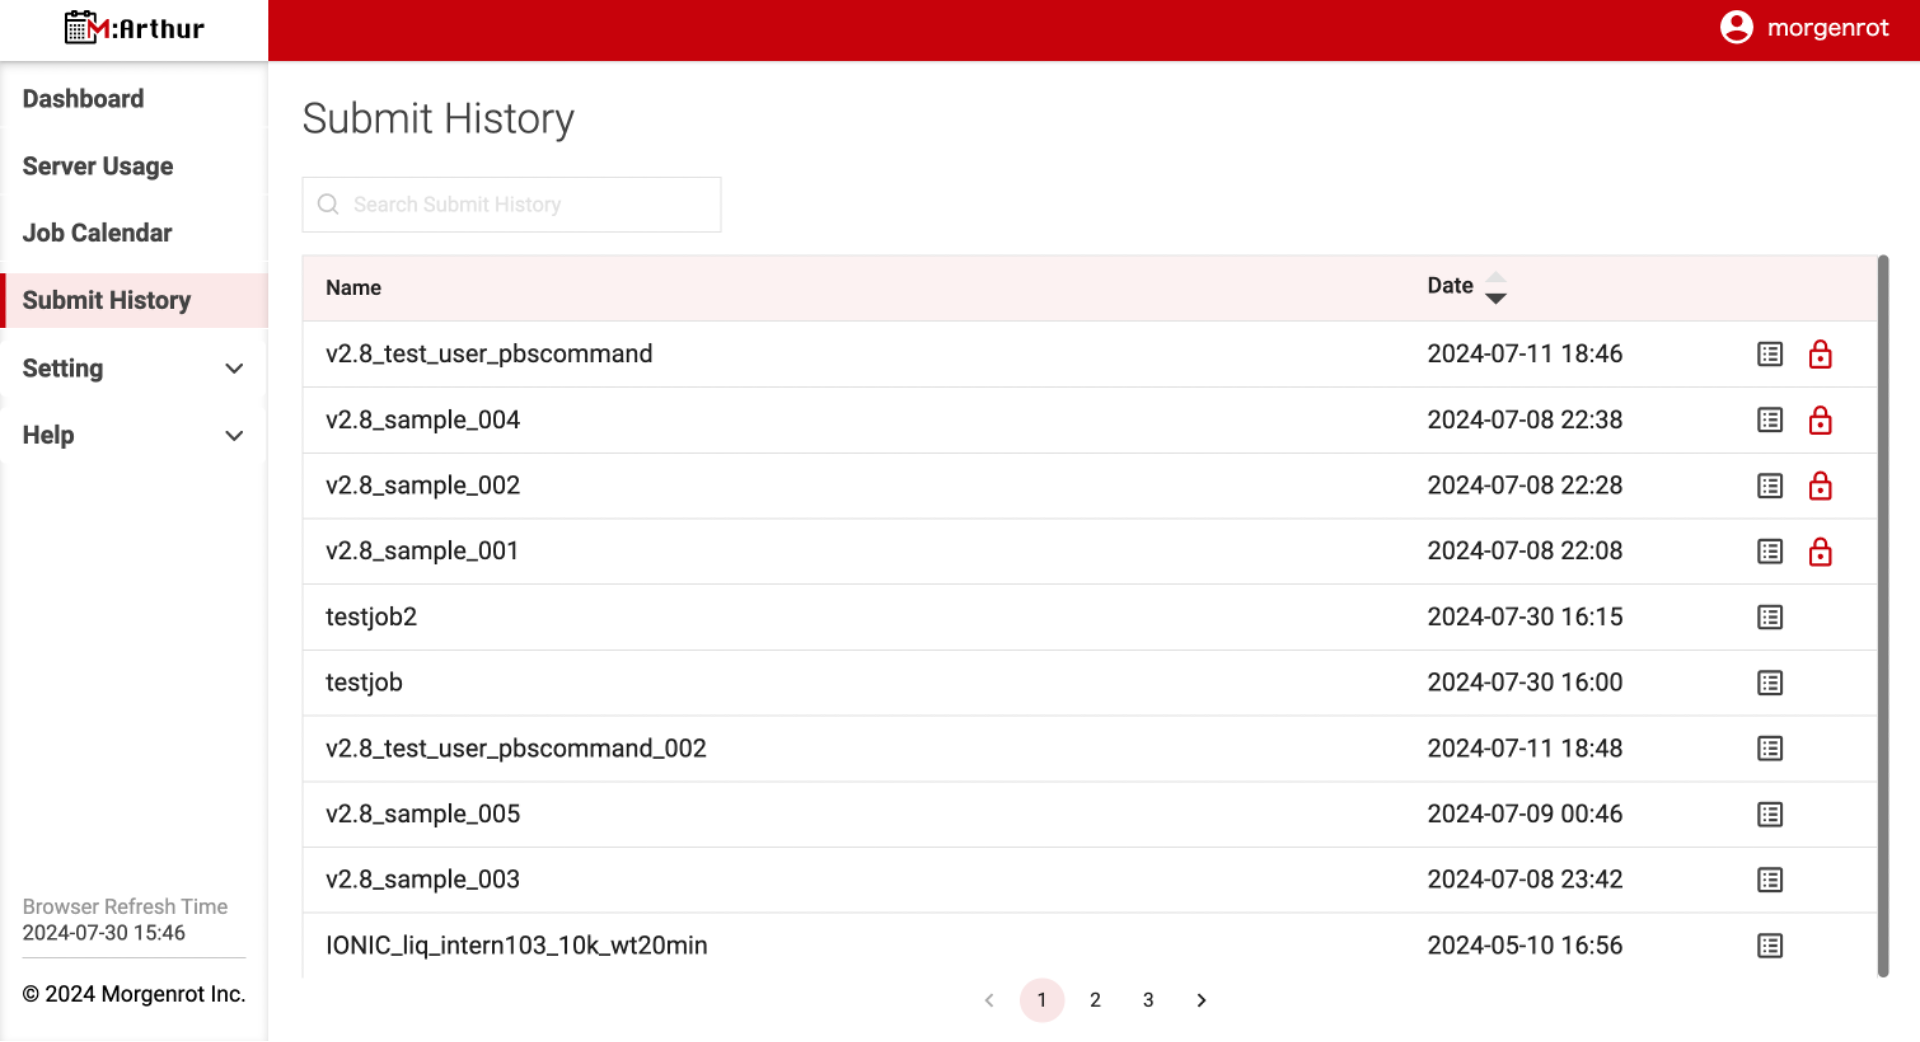
The items displayed on the 【Submit History】 screen are as follows.
| Item | Description |
|---|---|
| Name | Job registration name |
| Date | The time when the job started or is scheduled to start executing. |
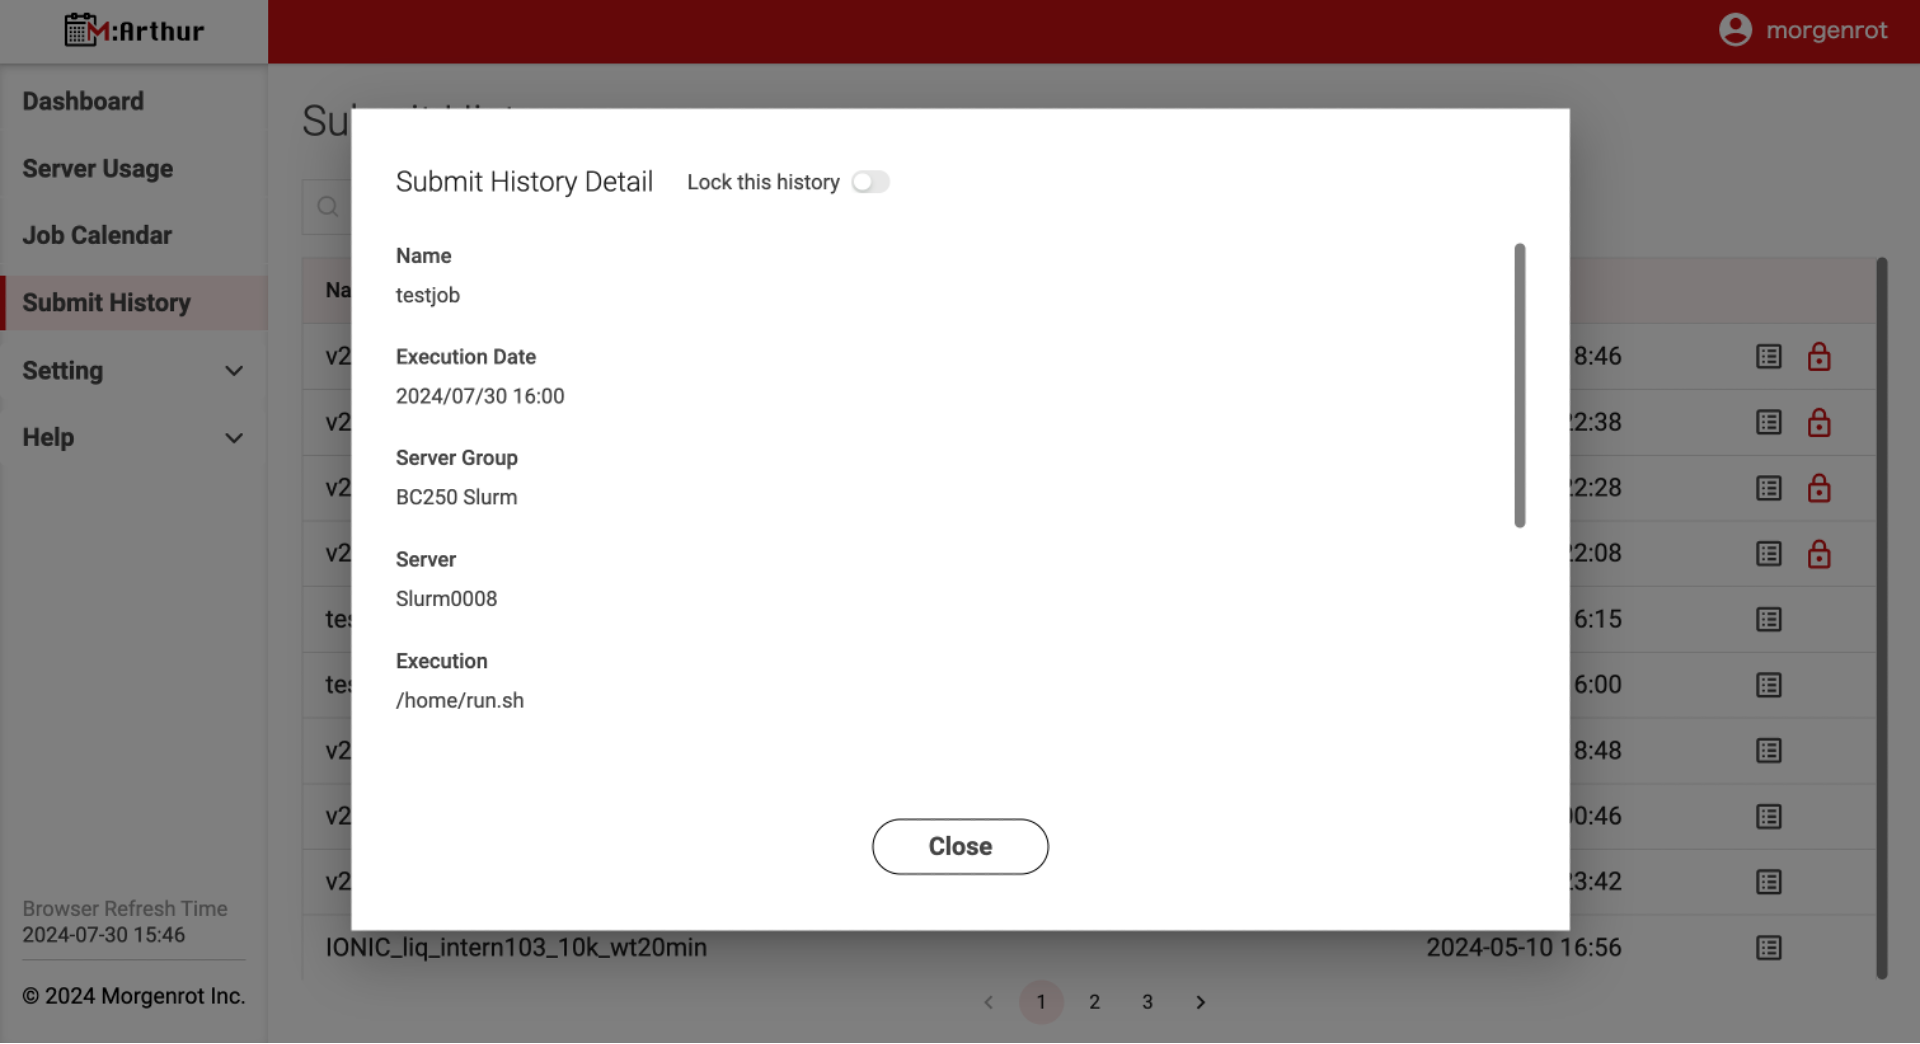
Clicking the[Detail]button to the right of the「Date」column will display the【Submit History Detail】modal screen, where you can view the job details.
The 【Submit History Detail】 screen will display the details of the job, including the items set when the job was registered (1.1. New Job Scheduling).
In the 【Submit History】 screen shown earlier, a maximum of 30 job registration histories are saved.
When the number of jobs increases and exceeds 30, the old job history is removed from the display.
If you want to keep the job history without removing it from the display target, for example to cite the job history later, you can lock the job history.
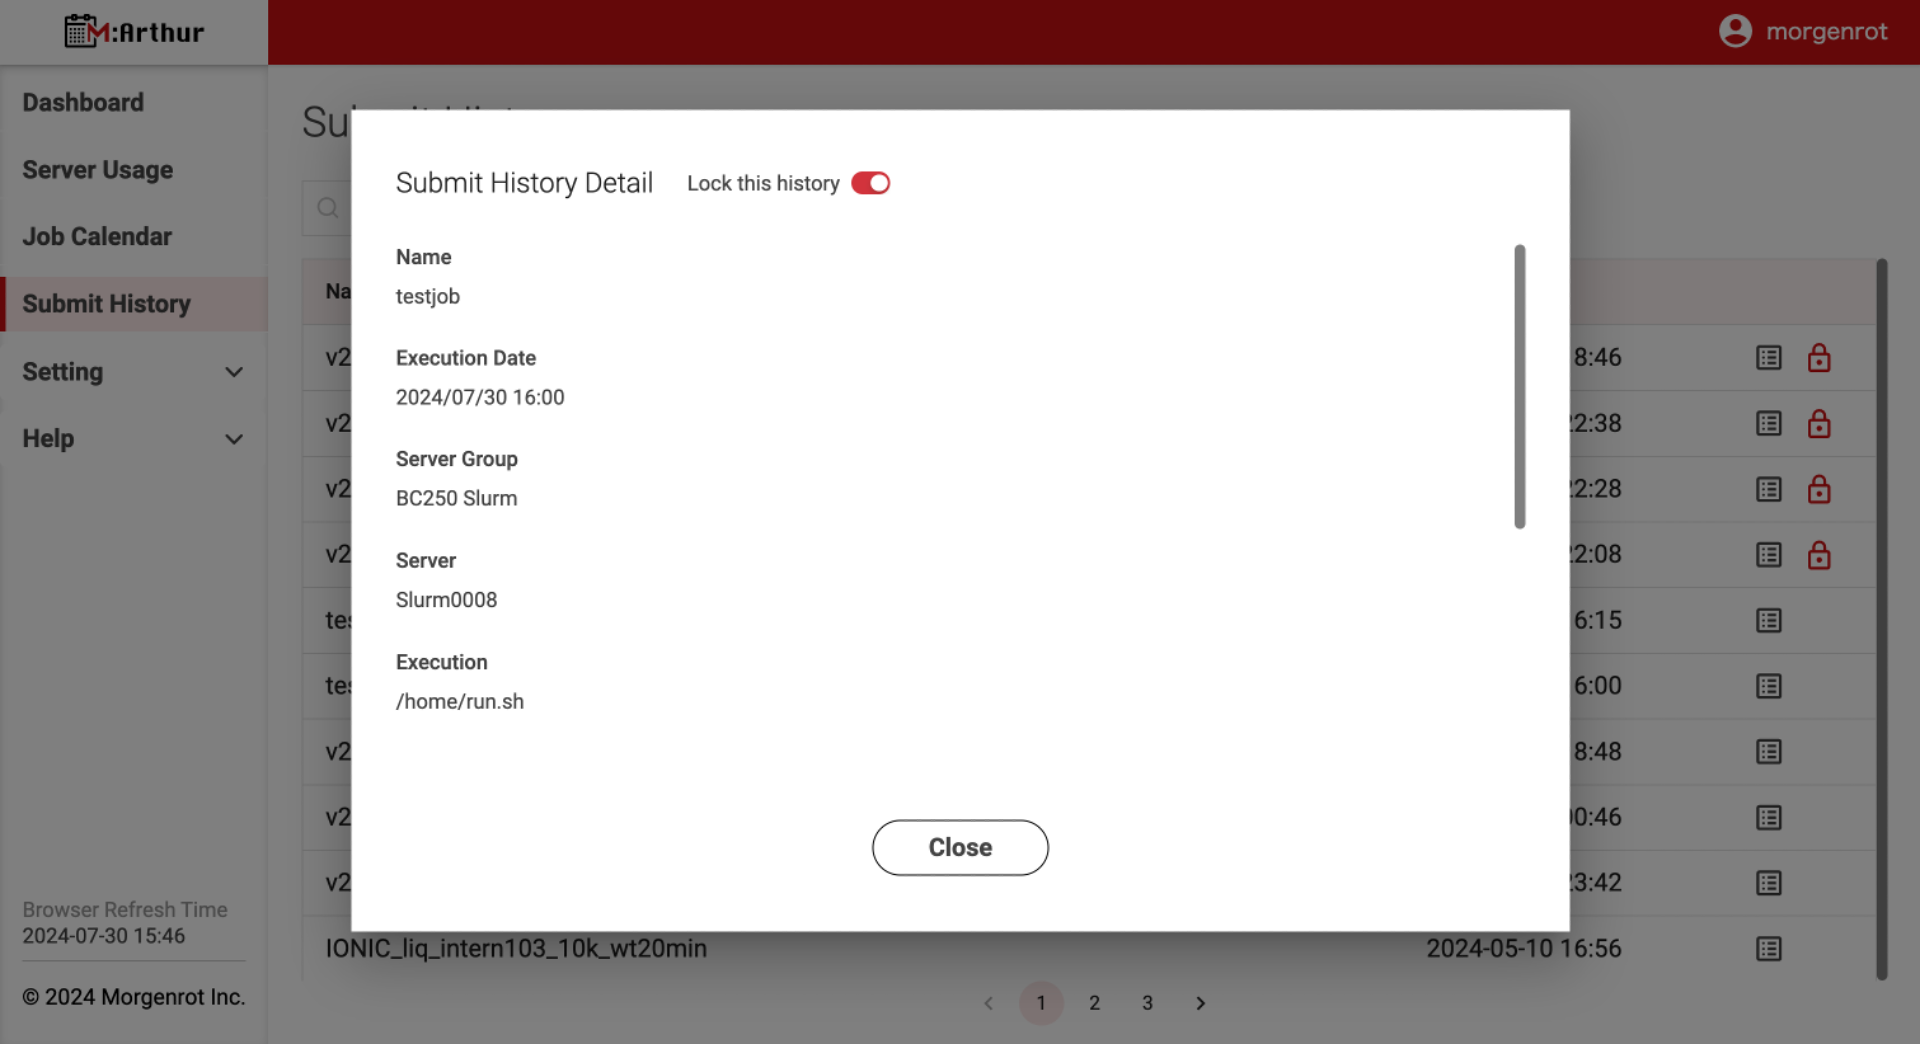
To lock the job history, click the [Lock this history] button at the top of the 【Submit History Detail】 screen (the button background will turn red) to activate the lock. In the figure below, the operation is performed on the job history whose 「Name」 is 「testjob」.
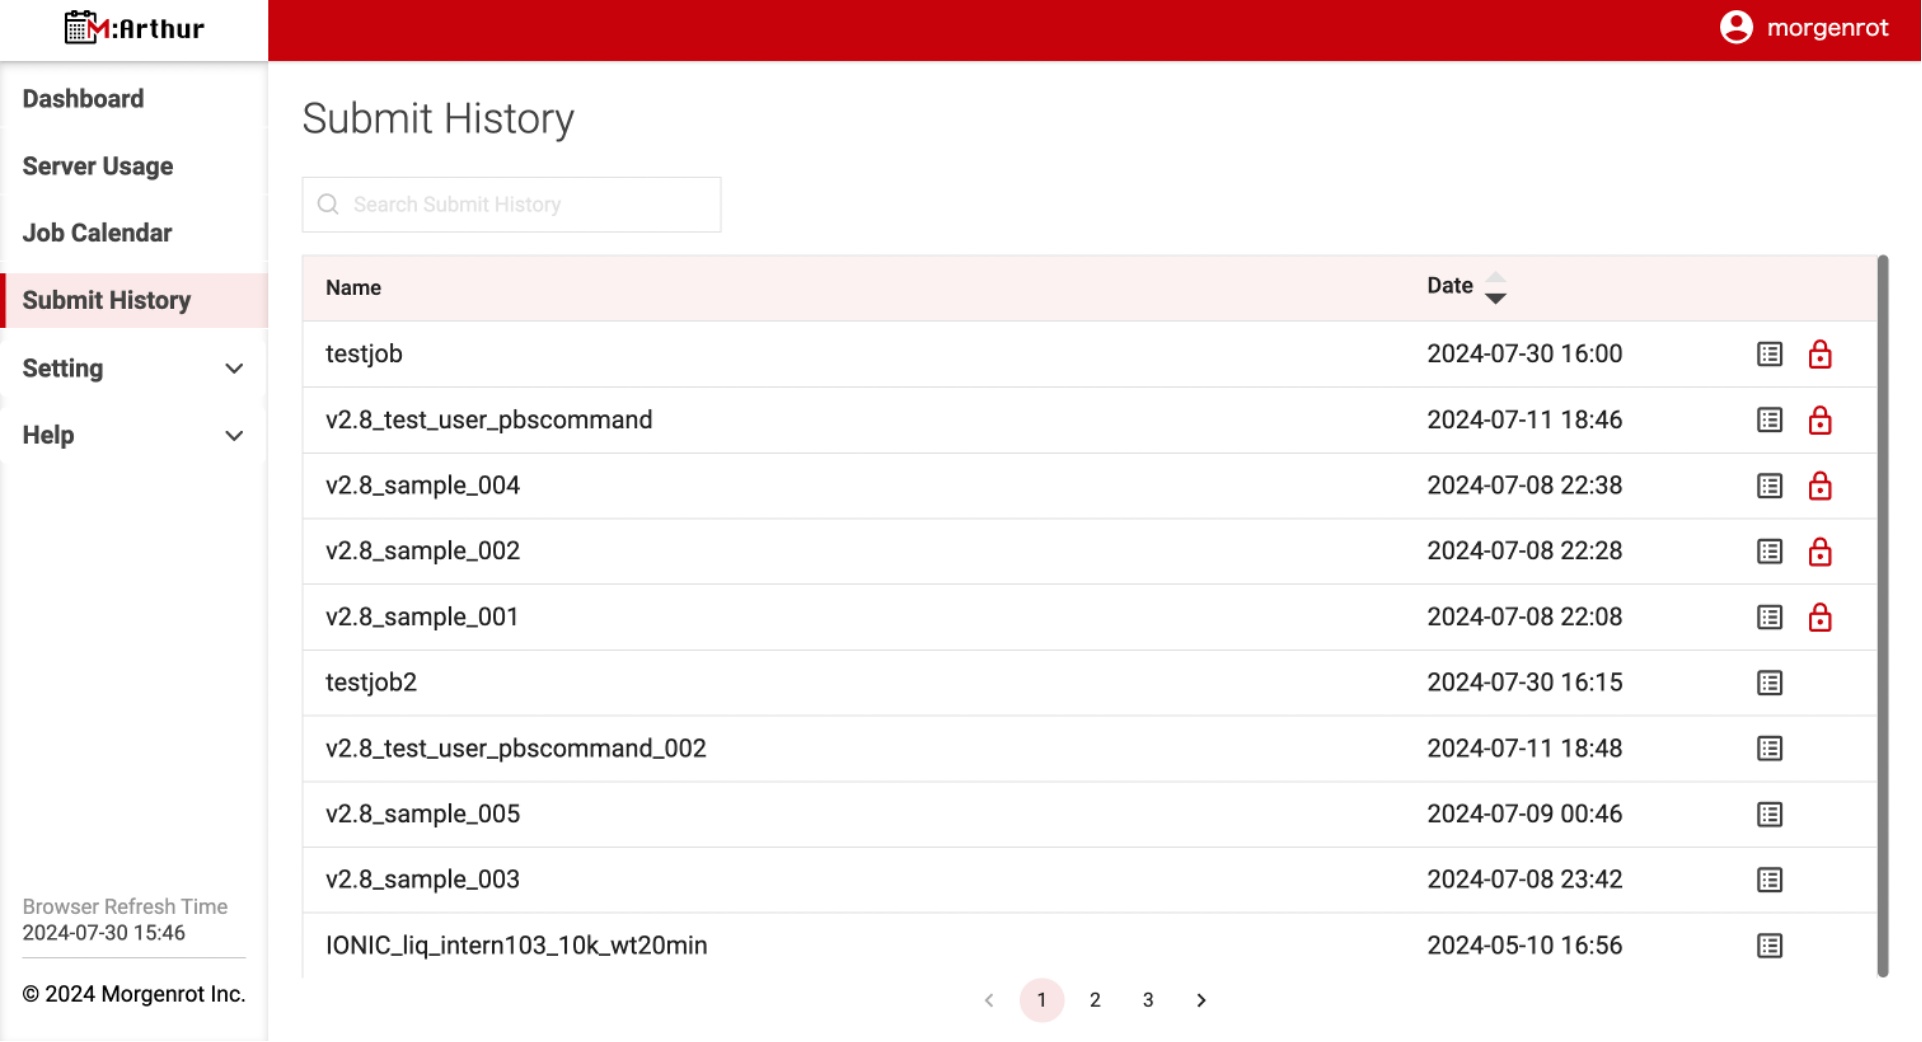
Execute the lock and click the [Close] button at the bottom of the 【Submit History Detail】 screen to return to the 【Submit History】 screen, the lock indicator mark (red lock mark) will appear on the job (the job whose「Name」 is 「testjob」).
In this state, the job history is locked, and even if the number of jobs increases and exceeds 30, the relevant history remains as a display target.
Tips
The total maximum number of job histories stored for display is 30, regardless of whether they are locked or not.1.3. Scheduling Jobs Based on History
The following describes job scheduling based on 1.2. Job History.
First, open the【Job Calendar】screen by selecting〈Job Calendar〉from the left menu bar. Click the[+Add Schedule]button in the upper left corner of the screen to open the【Add Schedule】screen.
In the 【Add Schedule】 screen, click the [Import] button (the same type as [Download]) in the upper right corner of the modal.
After clicking the button, the 【Import from Submit History】 screen will open.
You will see the 「testjob」 that you just locked in 1.2. Job History.
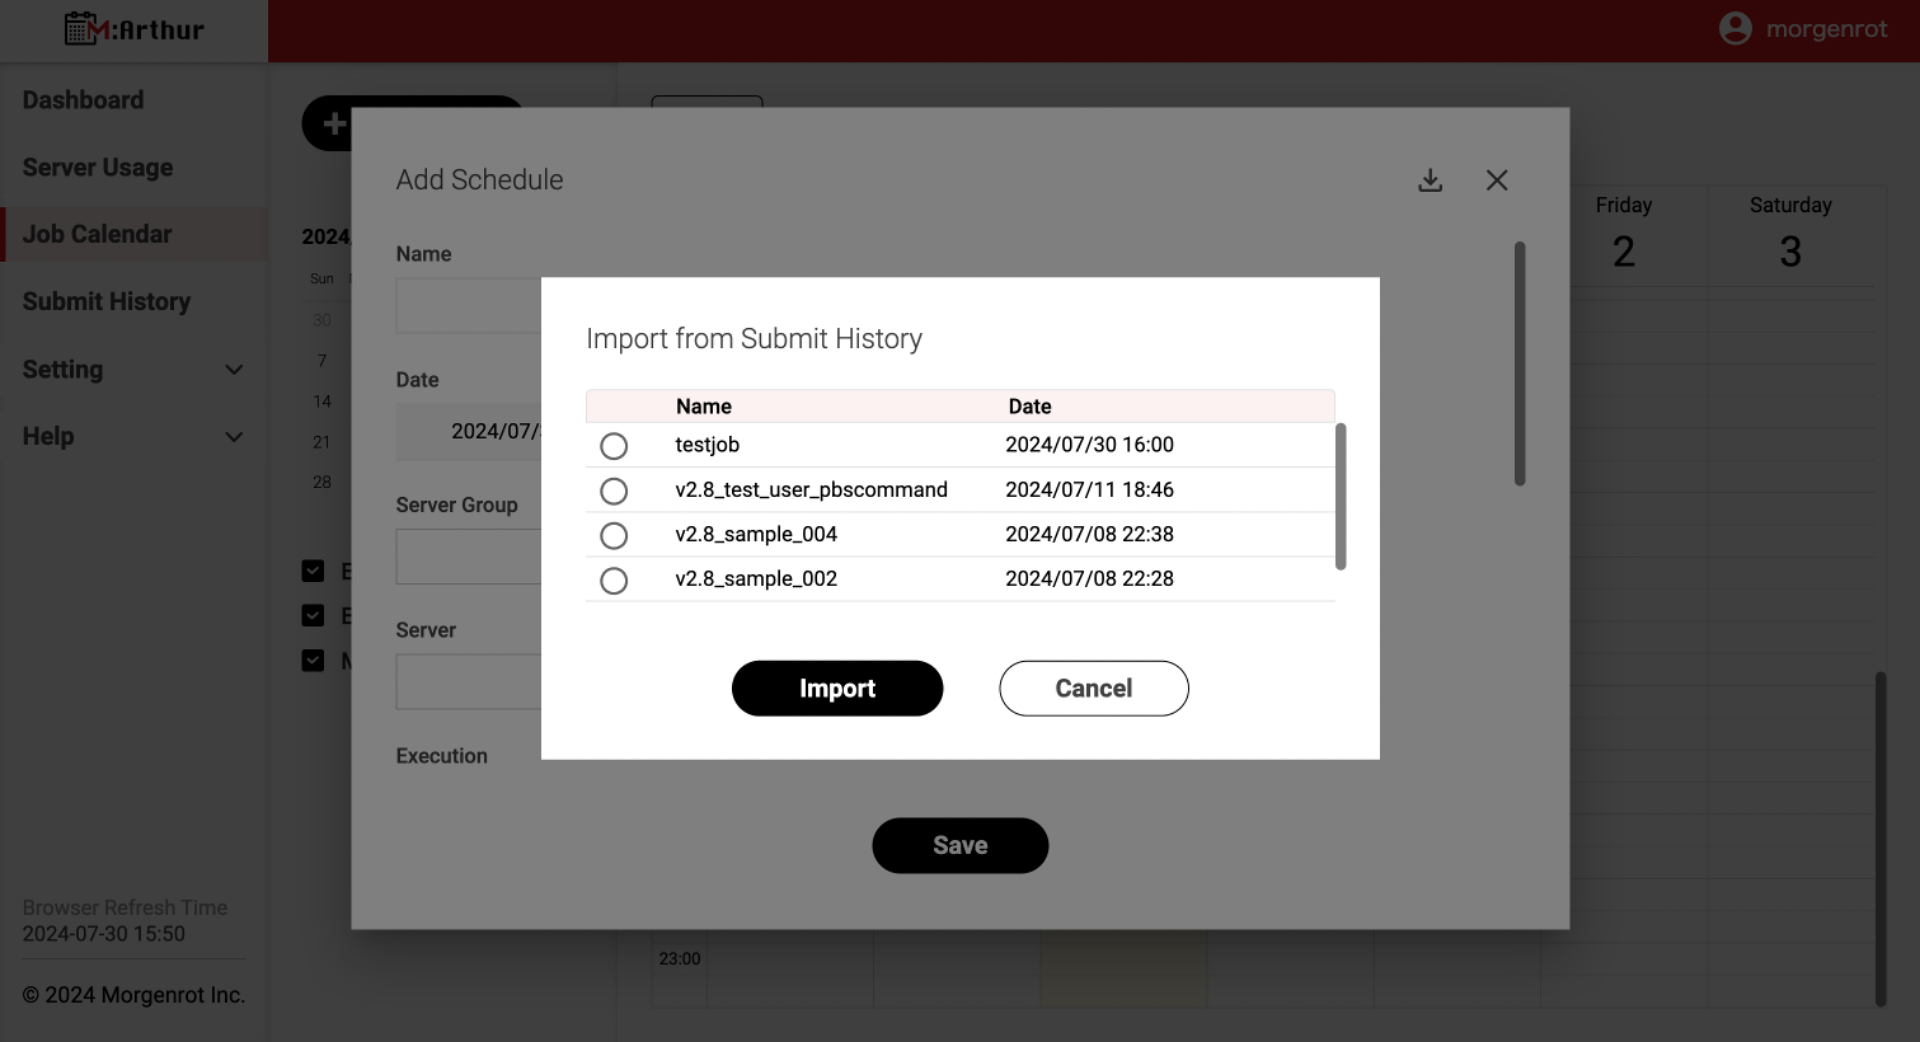
Check「testjob」and click the[Import]button at the bottom of the screen.
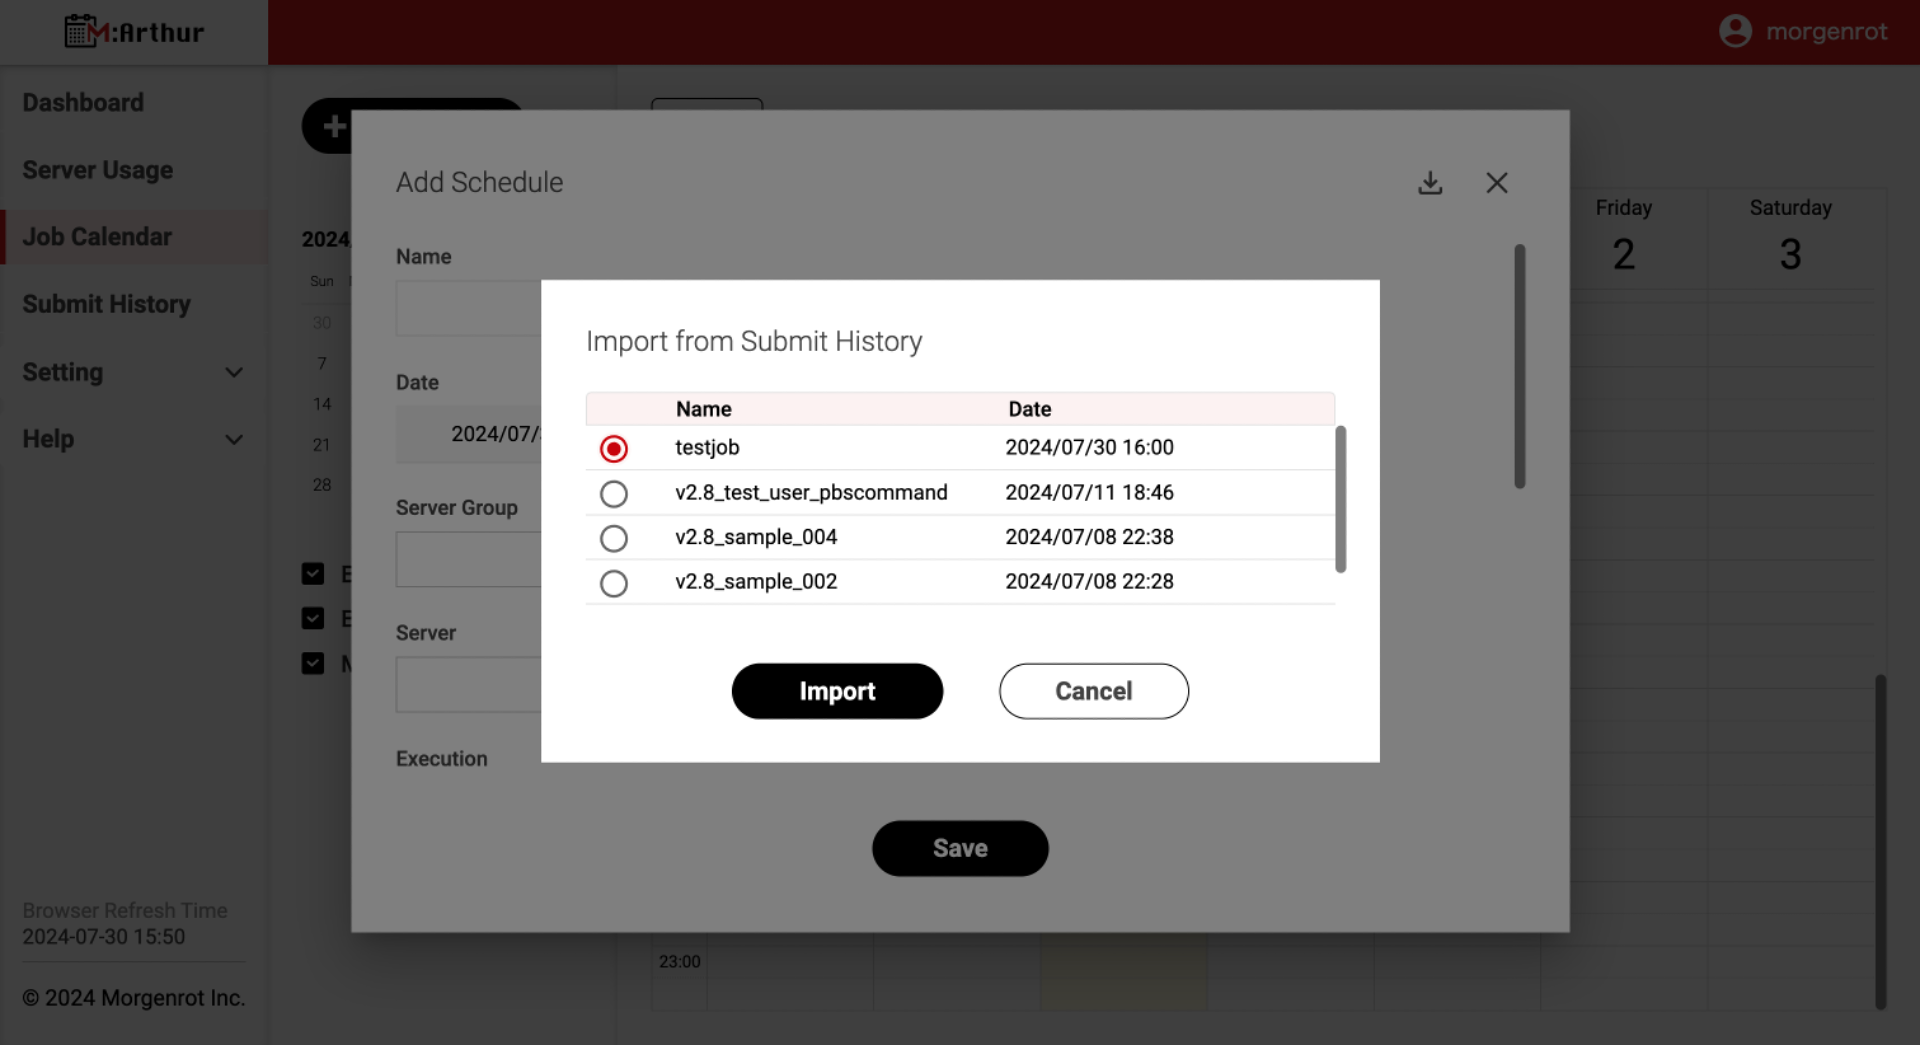
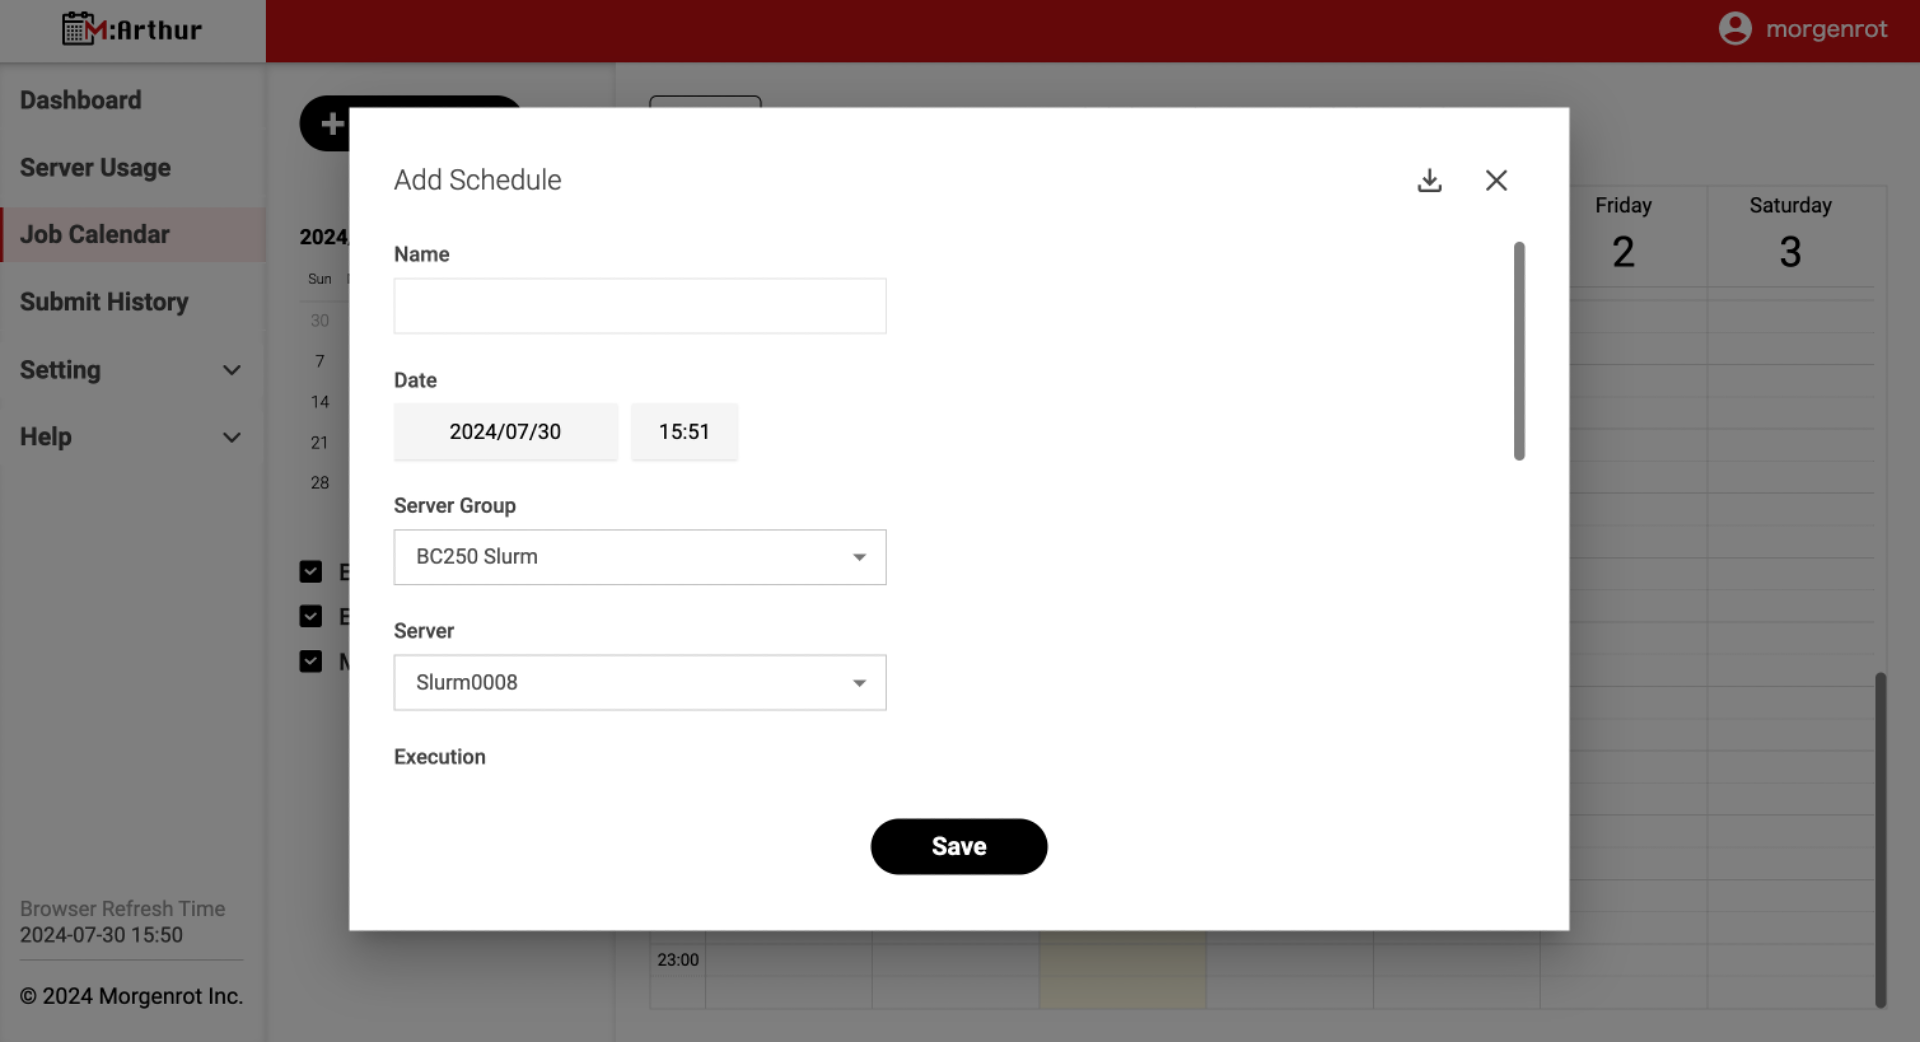
This will load the execution conditions for the 「testjob」from the history, and each item in the 【Add Schedule】 screen will be pre-filled accordingly.
After that, fill in the「Name」and other fields as described in 1.1. New Job Scheduling. Then, click the [Save] button at the bottom of the 【Add Schedule】 screen to register the job. The registered job will be executed according to the configured server and execution conditions when the scheduled start time arrives.
Tips
To prevent accidental operation, the following items are not read or reflected in the history information.
- Name (to prevent duplicate entries in the history, the following items will not be read or reflected)
- Date (reflects the date and time of the new operation, not the date and time in the history)
- Note (to prevent duplication with the history, it will not be read or reflected)
This is the end of the operations related to the execution of the job.
2. Job Verification
M:Arthur allows you to view a variety of information about your jobs. The following sections describe how to check the Dashboard, Server Usage, and Job Calendar.
2.1. Displaying the Dashboard
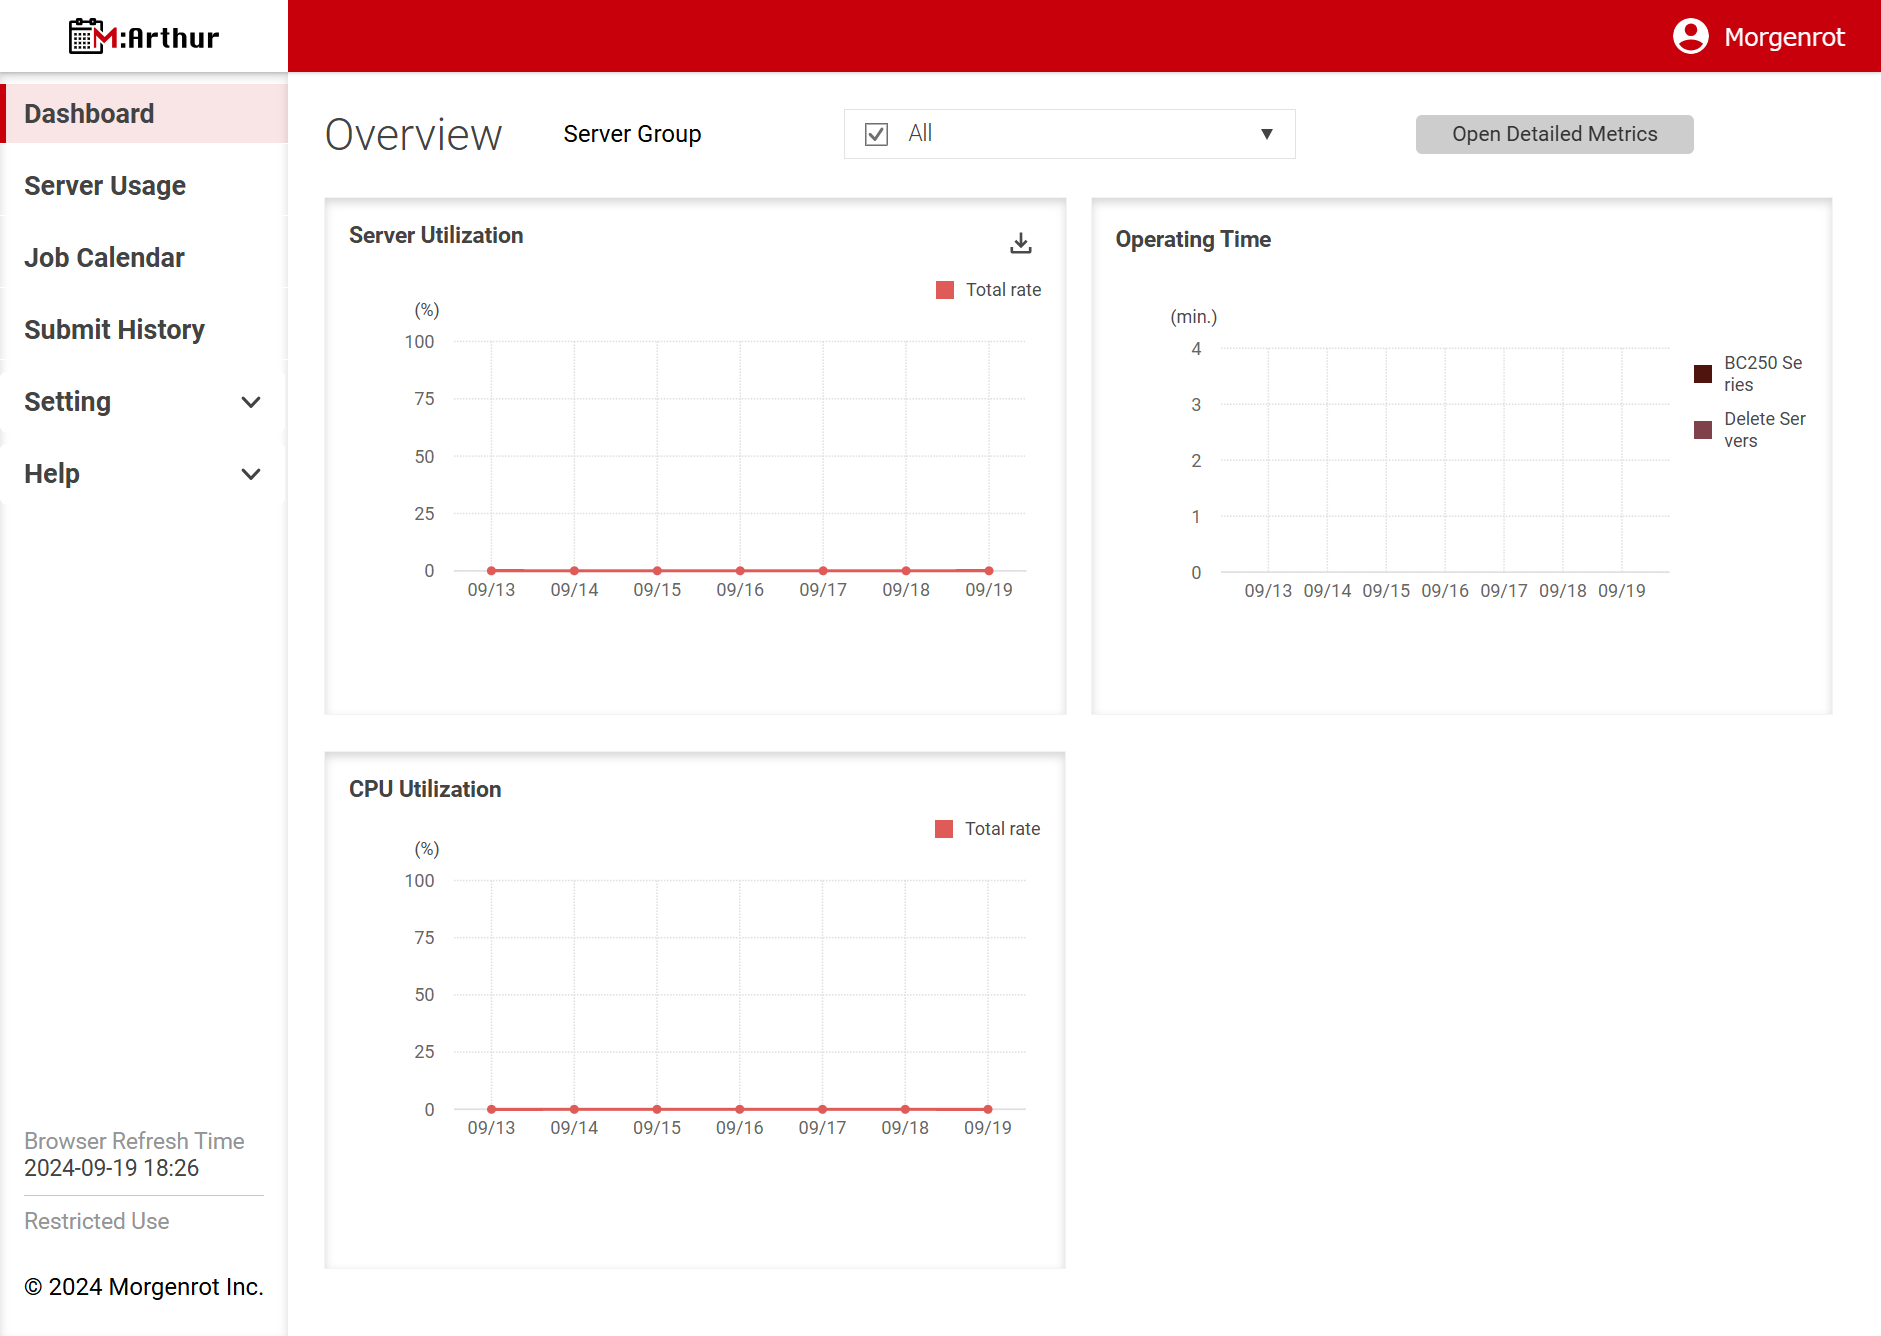
The 【Overview】 screen is displayed by selecting 〈Dashboard〉 from the left menu bar. The 【Overview】 screen allows you to view information about the server as a whole. In the initial state, you can check the server utilization(Server Utilization), operating time(Operating Time), and CPU utilization(CPU Utilization) by day (DD/MM). The Server Utilization is the total utilization of all servers in the system.
Details of each item are as follows
| Item Name | Description |
|---|---|
| Overall Server Utilization (Server Utilization) | The following utilization rates are calculated on a daily basis and displayed in a graph. Calculation formula: Total uptime of each server / (Total number of servers x 24 hours) |
| Job execution time of each server group (Operating Time) | The following times are calculated for each day and displayed in a graph. Calculation formula: Total time each server in the server group was running (max. 1440 minutes) |
| Overall CPU utilization (CPU Utilization) | The following utilization rates are calculated for each day and displayed in a graph. Calculation formula: Total operating time of each CPU / (Total number of CPUs x 24 hours) * However, for the day, the denominator is the time up to the current time. |
Tips
- The server is considered to be in operation when it is running at least 1 CPU.
- The information displayed is fixed in the initial state. You can change or add the information and display format (graphs, tables, etc.) by contacting us separately.
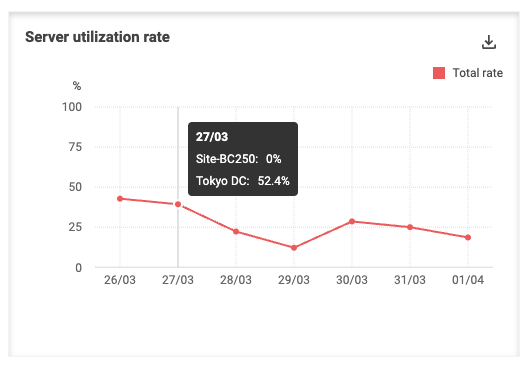
In 【Overview】, detailed information about the date and availability is displayed by mouse-over.
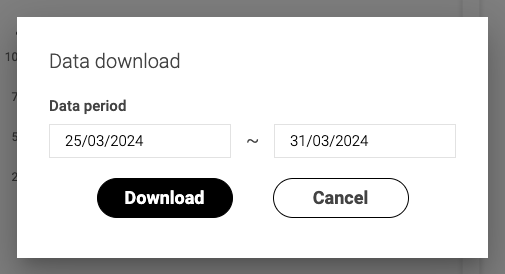
The data displayed in the graph can be downloaded in CSV format. Clicking the download button in the upper right corner of the(Server Utilization) column in the【Overview】 section will pop up the 【Data download】 screen. Enter a period of time in the Data period field and click the Download button to begin downloading the CSV file. The period of time can be specified as any date after the date M:Arthur was installed. Clicking the [Cancel] button cancels the operation.
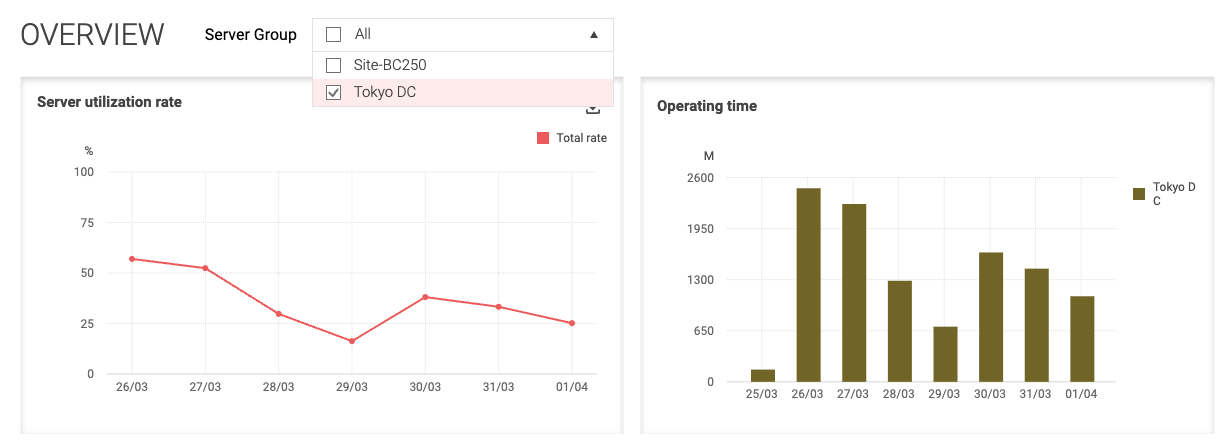
In [Overview], if the administrator has registered multiple server groups, the server group to be displayed can be selected from the Server Group pull-down menu at the top of the screen. If multiple server groups are selected, the graph will combine information from each server. Specifically, the overall server utilization (Server Utilization) is displayed for all servers in the selected server group. Job execution time (Operating Time) for each server group is displayed for the selected server group, with information for each server group. The selection of the server group is also reflected in the CSV when downloading the data displayed in the graph.
About the Open Detailed Metrics Button
The [Open Detailed Metrics] button, located in the upper left corner of the OverView screen, allows you to move to a screen that displays additional information unique to your organization in addition to the standard information (graphs). This function is only available to administrators of subscribed organizations.
For more information on Detailed Metrics or to subscribe, please contact us at here.
2.2 Displaying Server Usage Status
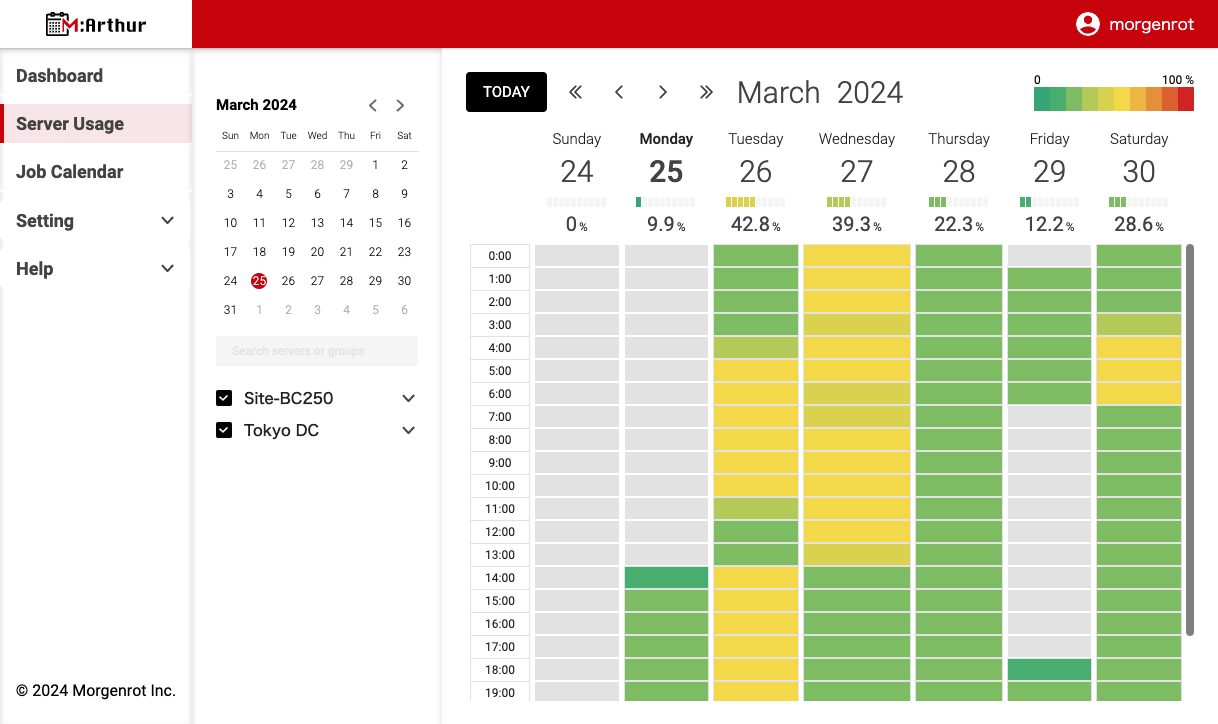
By selecting 〈Server Usage〉 from the left menu bar, the【Server Usage】screen (calendar-style display screen) will appear.
The 【Server Usage】 screen allows you to visually check the server utilization rate in detail by date and time. The main calendar view displays server utilization for each server group. The server groups and servers to be displayed can be selected from the check boxes on the left side of the main calendar. In the main calendar, the dates and times when the server group and server to be displayed was operating are colored according to the availability. In addition, the daily availability is displayed as a percentage directly below each date in the main calendar.
Tips
The server utilization rate is “the sum of the uptime per unit of time for each server displayed / (number of servers displayed x unit of time)”.The unit of time is 1 hour in the calendar (colored area) and 24 hours in the percent display at the top of the calendar.
In the initial state of【Server Usage】, the main calendar is displayed as 1 week.
When in the 1-week view, selecting [Date] (which can be pressed like a button) from the month calendar on the left side of the main calendar will move the view to the week to which that date belongs.
In [Server Usage], selecting [Date] (which can be pressed like a button) in the main calendar will switch to a day-by-day date view. 1-day view shows the utilization rate of each server group side by side. In addition, selecting[Server Group Name](which can be pressed like a button) will display the utilization rate for each server in the server group. In the daily view, selecting [Date] (which can be clicked like a button) from the monthly calendar on the left side of the main calendar will move the view to that date.
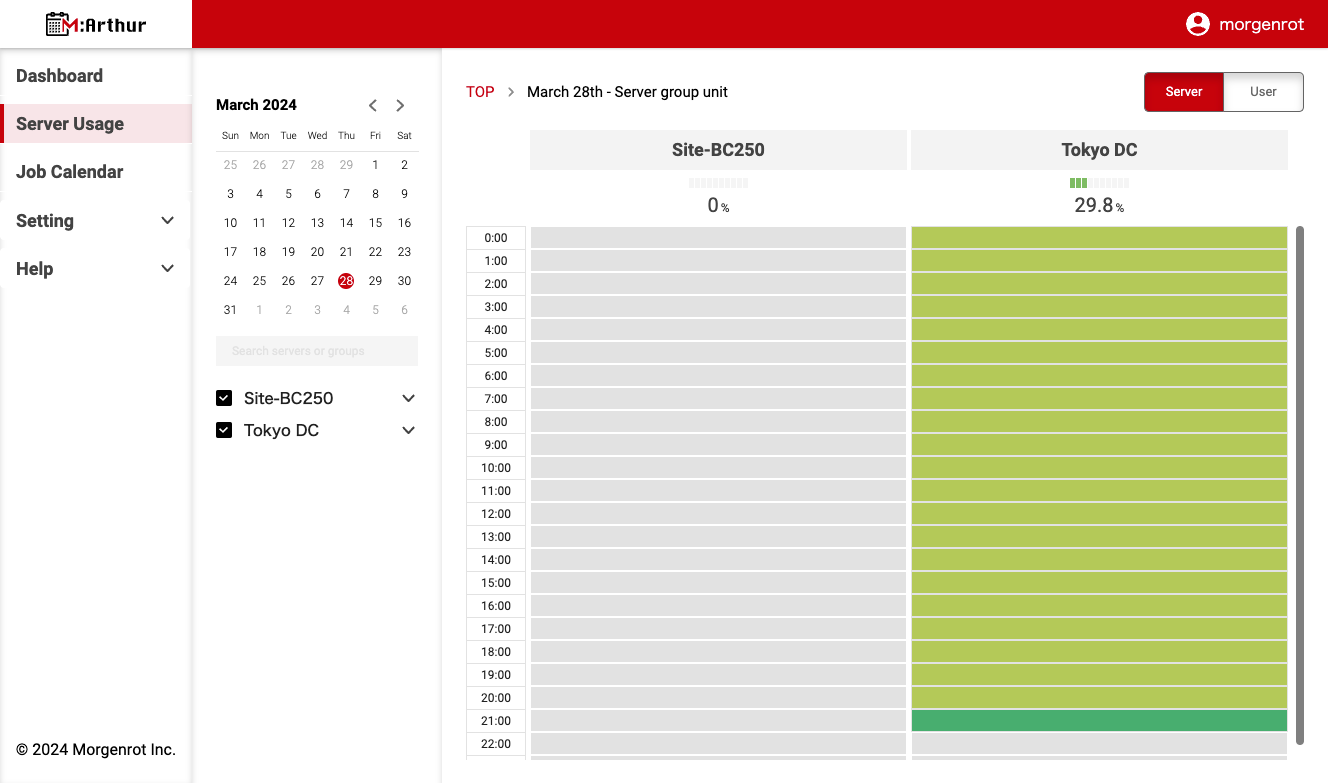
When the day-by-day view is displayed in【Server Usage】, you can switch between server group and user group views by clicking the [Server] and [User] buttons in the upper right corner of the screen. In the user group view, the total utilization rate for all users is displayed by default. You can display the total utilization rate for specific users by checking each user’s checkbox.
Tips
The server utilization rate is 「the sum of the uptime per unit time for each server in the display /(number of servers in the display × unit time)」. The unit time is 1 hour in the calendar (colored area), and 24 hours in the percentage display at the top of the calendar.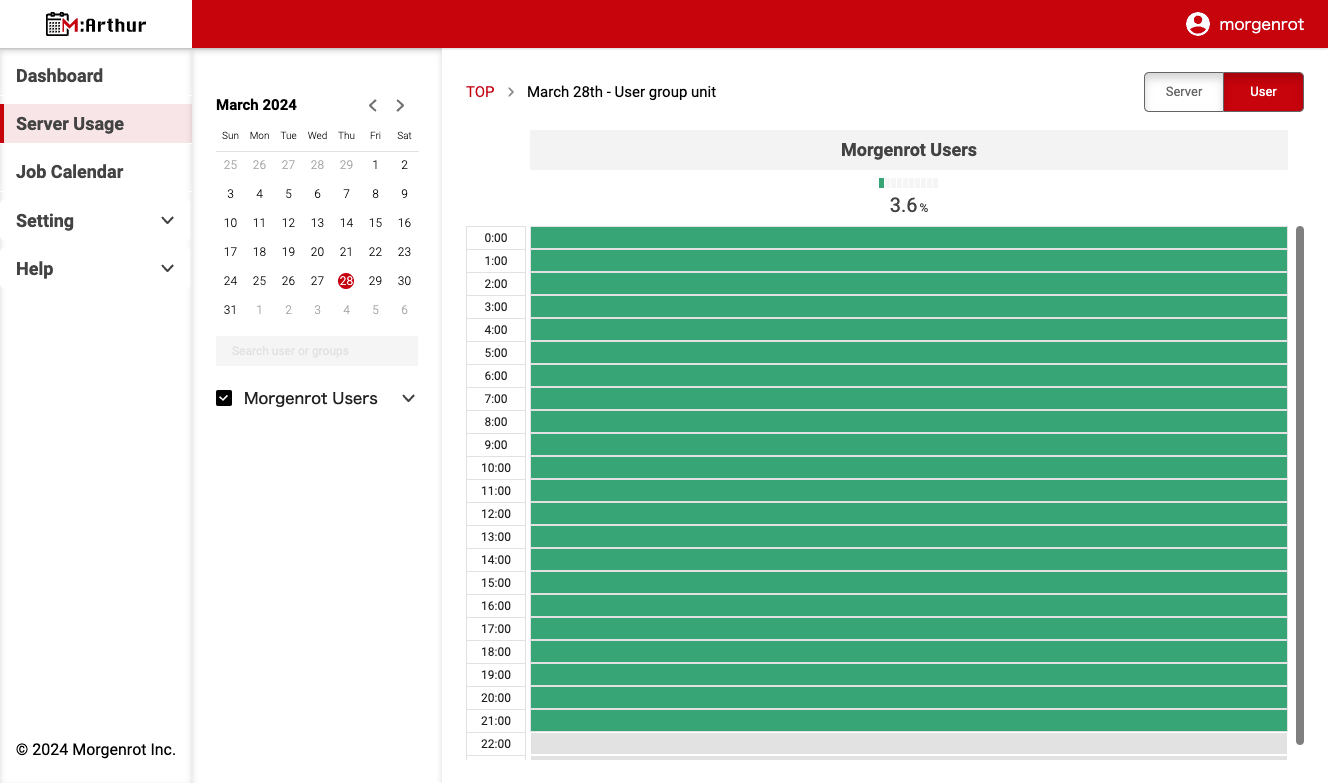
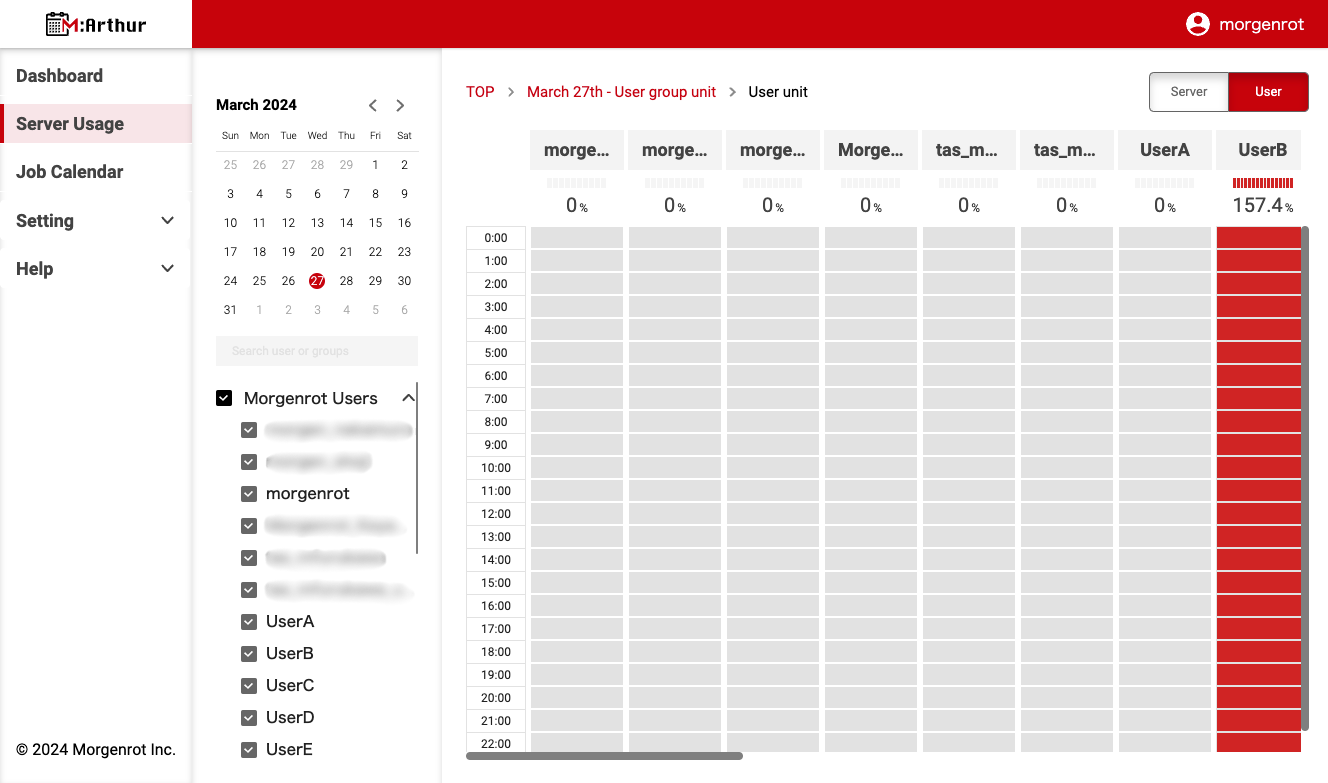
After pressing the [User] button in the upper right corner of the screen in [Server Usage], press the [User Group Name] at the top (you can press it like a button) to display the server utilization rate for all users.
Tips
The utilization rate for each user is 「(number of servers used by each user x sum of uptime per unit time for each server) / unit time」.
Therefore, if one user uses two or more servers, the display may exceed 100%.
The unit time is 1 hour in the calendar (colored area) and 24 hours in the percentage display at the top of the calendar.
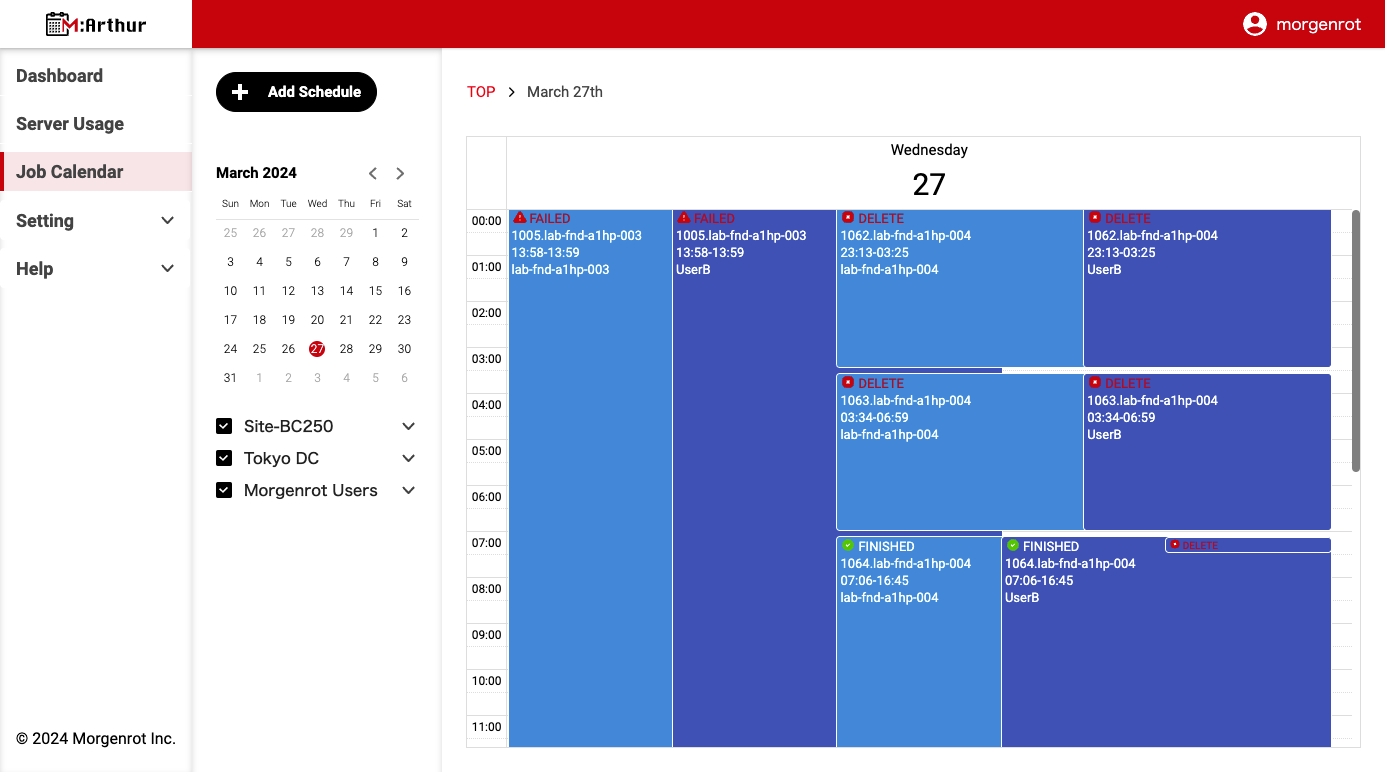
2.3. Viewing the Job Calendar
By selecting 〈Job Calendar〉 from the left menu bar, the 【Job Calendar】 screen (calendar-style display) will appear.
The 【Job Calendar】 allows you to manage job execution status in a calendar format. Like 【Server Usage】, you can toggle the display between server groups and user groups. In M:Arthur, when a job is submitted, a time frame is displayed on the calendar.
Each job is displayed by state: waiting for execution(CREATE), running(RUNNING), executed(FINISHED), aborted(DELETE), or failed(FAILED).
Tips
The execution waiting state (CREATE) is indicated by a combination of the time until the execution instructions are sent from M:Arthur to the server and the time spent waiting for execution on the server (states such as Waiting and Queued in OpenPBS and PENDING in Slurm).The【Job Calendar】 displays not only jobs submitted on M:Arthur, but also jobs submitted from the command line.
In both cases, jobs running without a supported job scheduler will not be displayed.
Pressing the [Time Frame for each job] (which can be pressed like a button) will display details such as the job’s registration name, start and end times, and the server on which it was run.
For jobs submitted on M:Arthur, the contents of the shell script that was executed will also be displayed.
That’s all for the user instructions.